医学英語III
馬場美彦
14 April 2022
Authors
Gotaro Kojima
ORCIDとは、研究者のデータベース。ORCID ID を取得しておくと、自分で出版した論文などを管理することができる。
日本限定の researchmap というサービスも、ORCID データを参照している。
Abstract
- 日本は、他のどの国よりも急速に高齢化
- フレイルが重要な課題
- 日本の65歳以上の地域在住高齢者におけるフレイルの有病率を報告した2000年以降に発表されたあらゆる研究を対象に、
- 11の電子データベースの系統的文献検索
- 合計1529件の研究が同定され、5件の研究をレビュー
Japan’s population is aging more rapidly than that of any other country.
システマティックレビューのシステマティク(系統的)とは、どういう意味か?
- 文献を、データベースなどを使ってくまなく調査すること
- レビュアーが重要だと思う文献に絞ってレビューすること
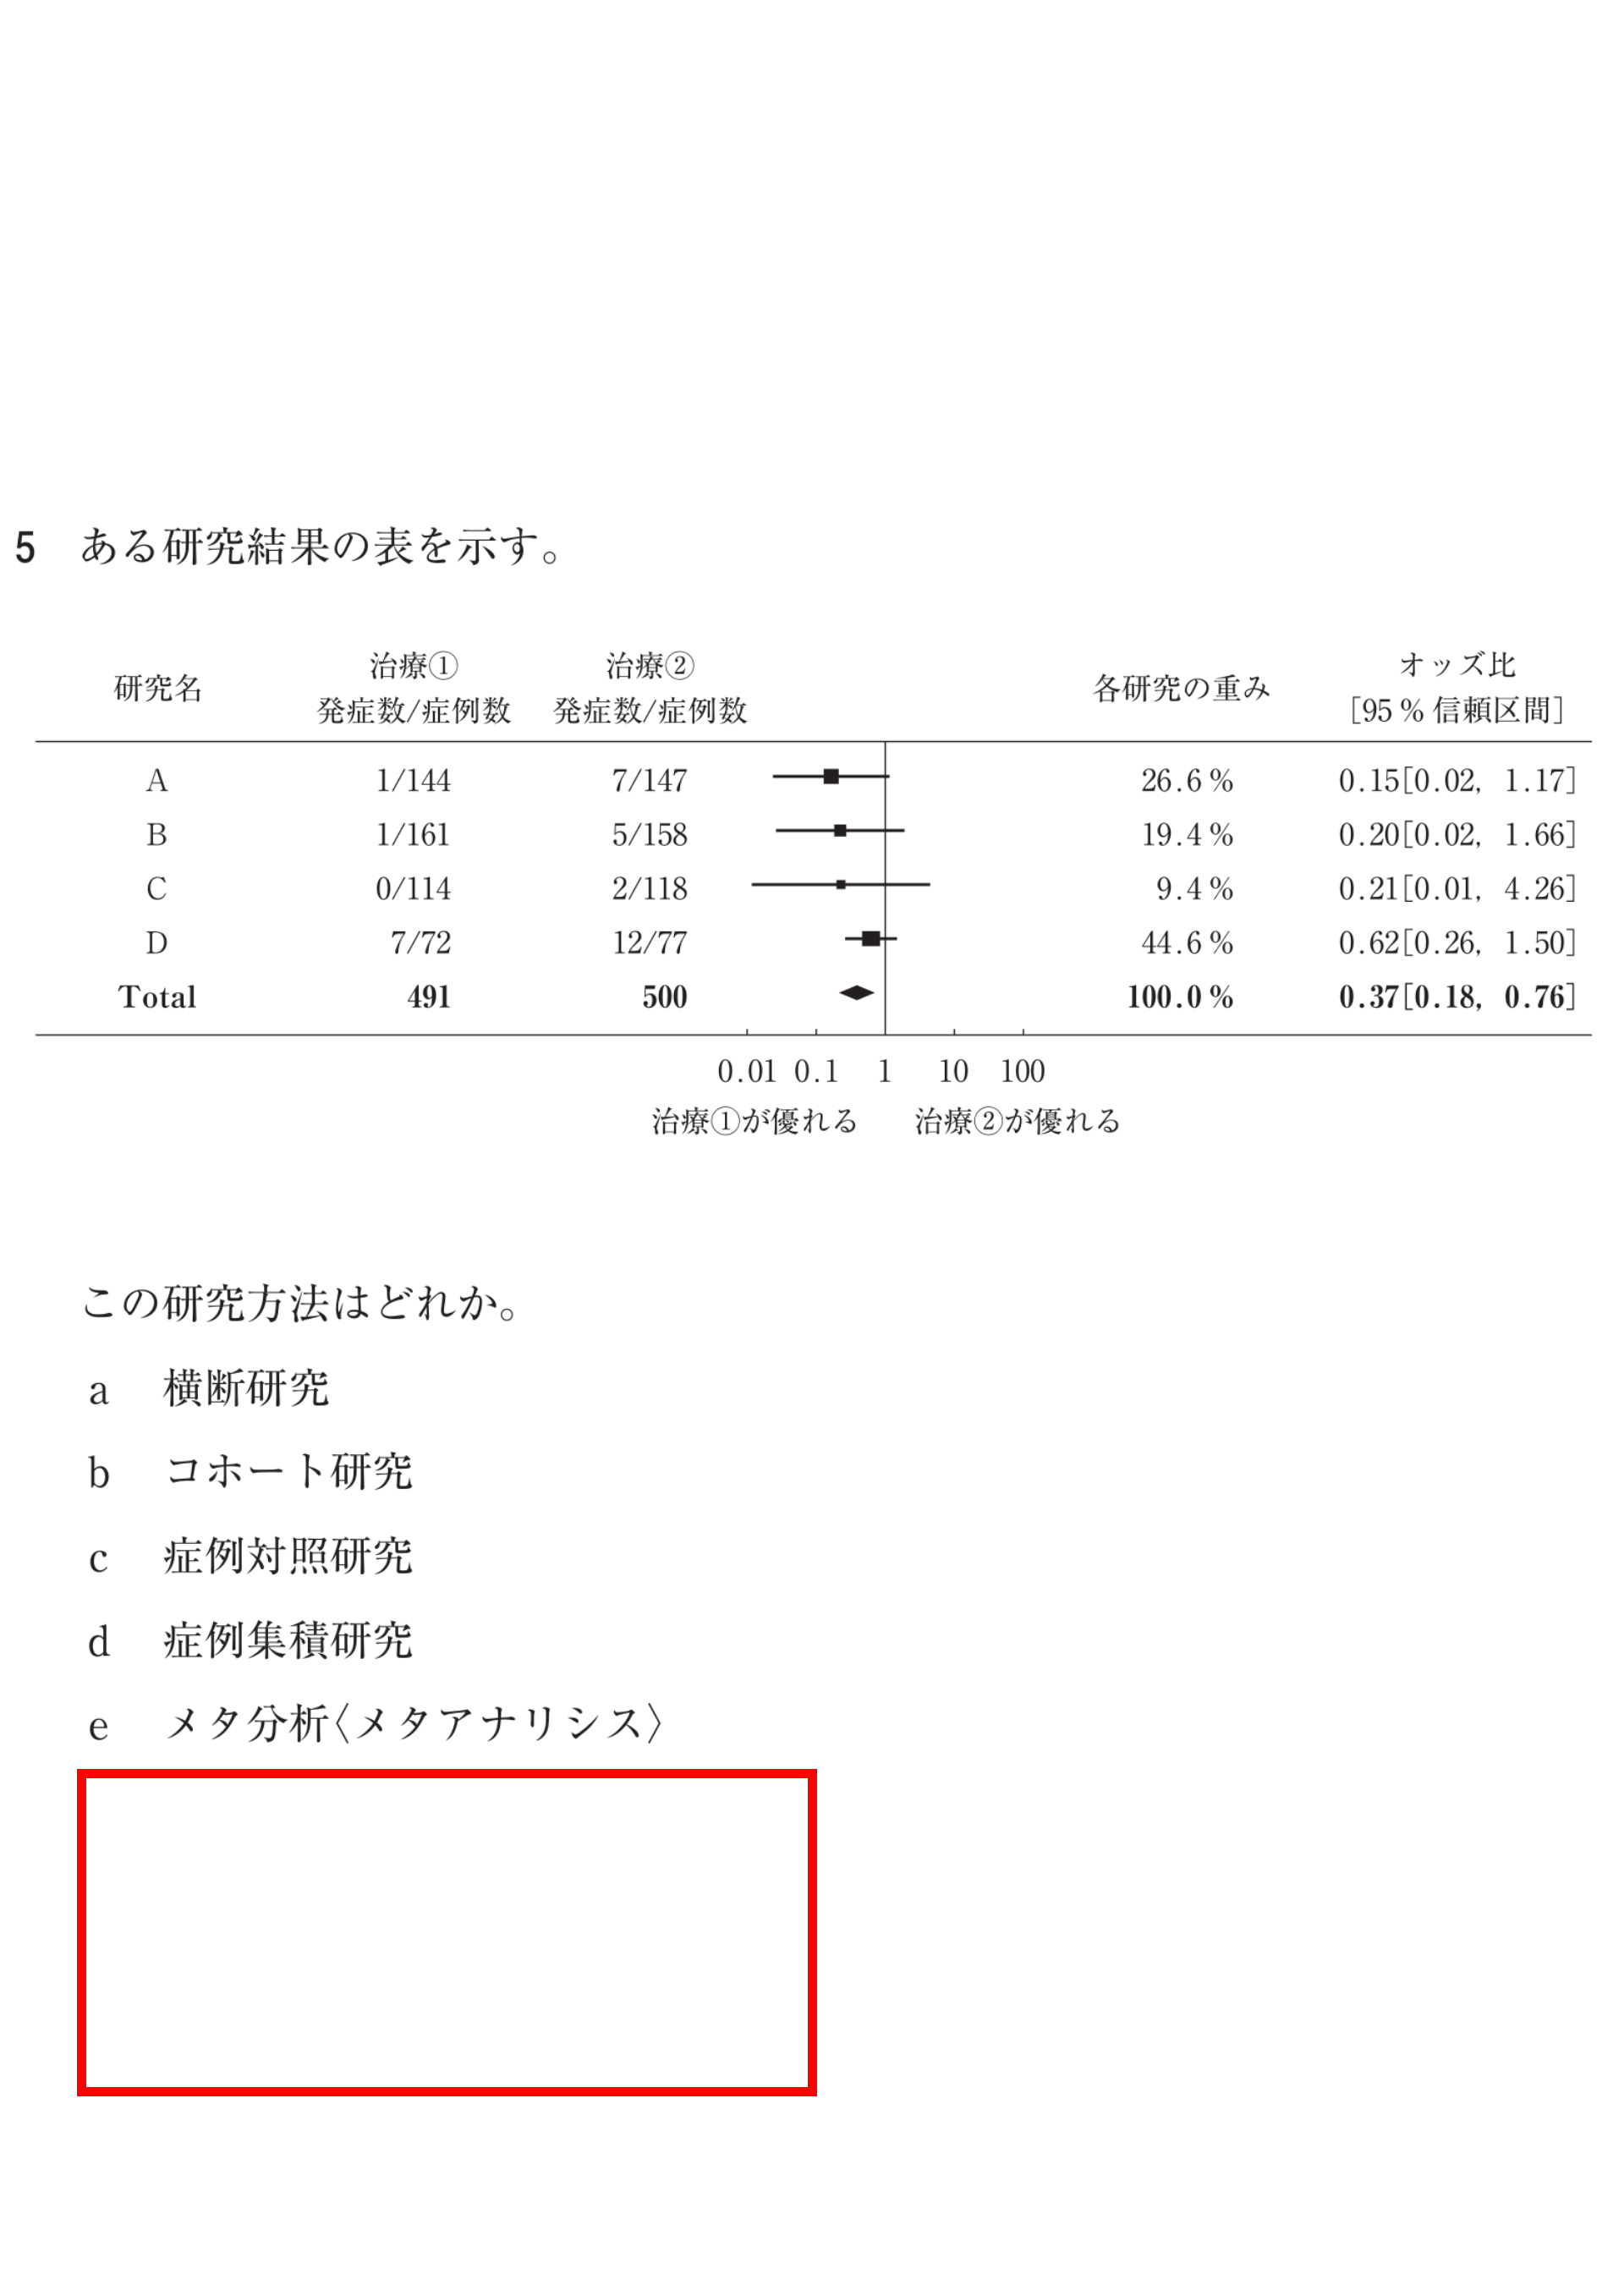
- pool: メタ分析等で、複数の研究に共通する同一のアウトカムを統合し計算しなおすこと
- heterogeneity: 異質性。複数の研究に共通する同一のアウトカムの値にばらつきがあること
- stratify: 層別化。対象者の背景でいくつかの層別化してサブグループ解析を行うこと
日本における65歳以上のフレイル率はどれくらいと思いますか?
- 約3.7%
- 約7.4%
- 約11.1%
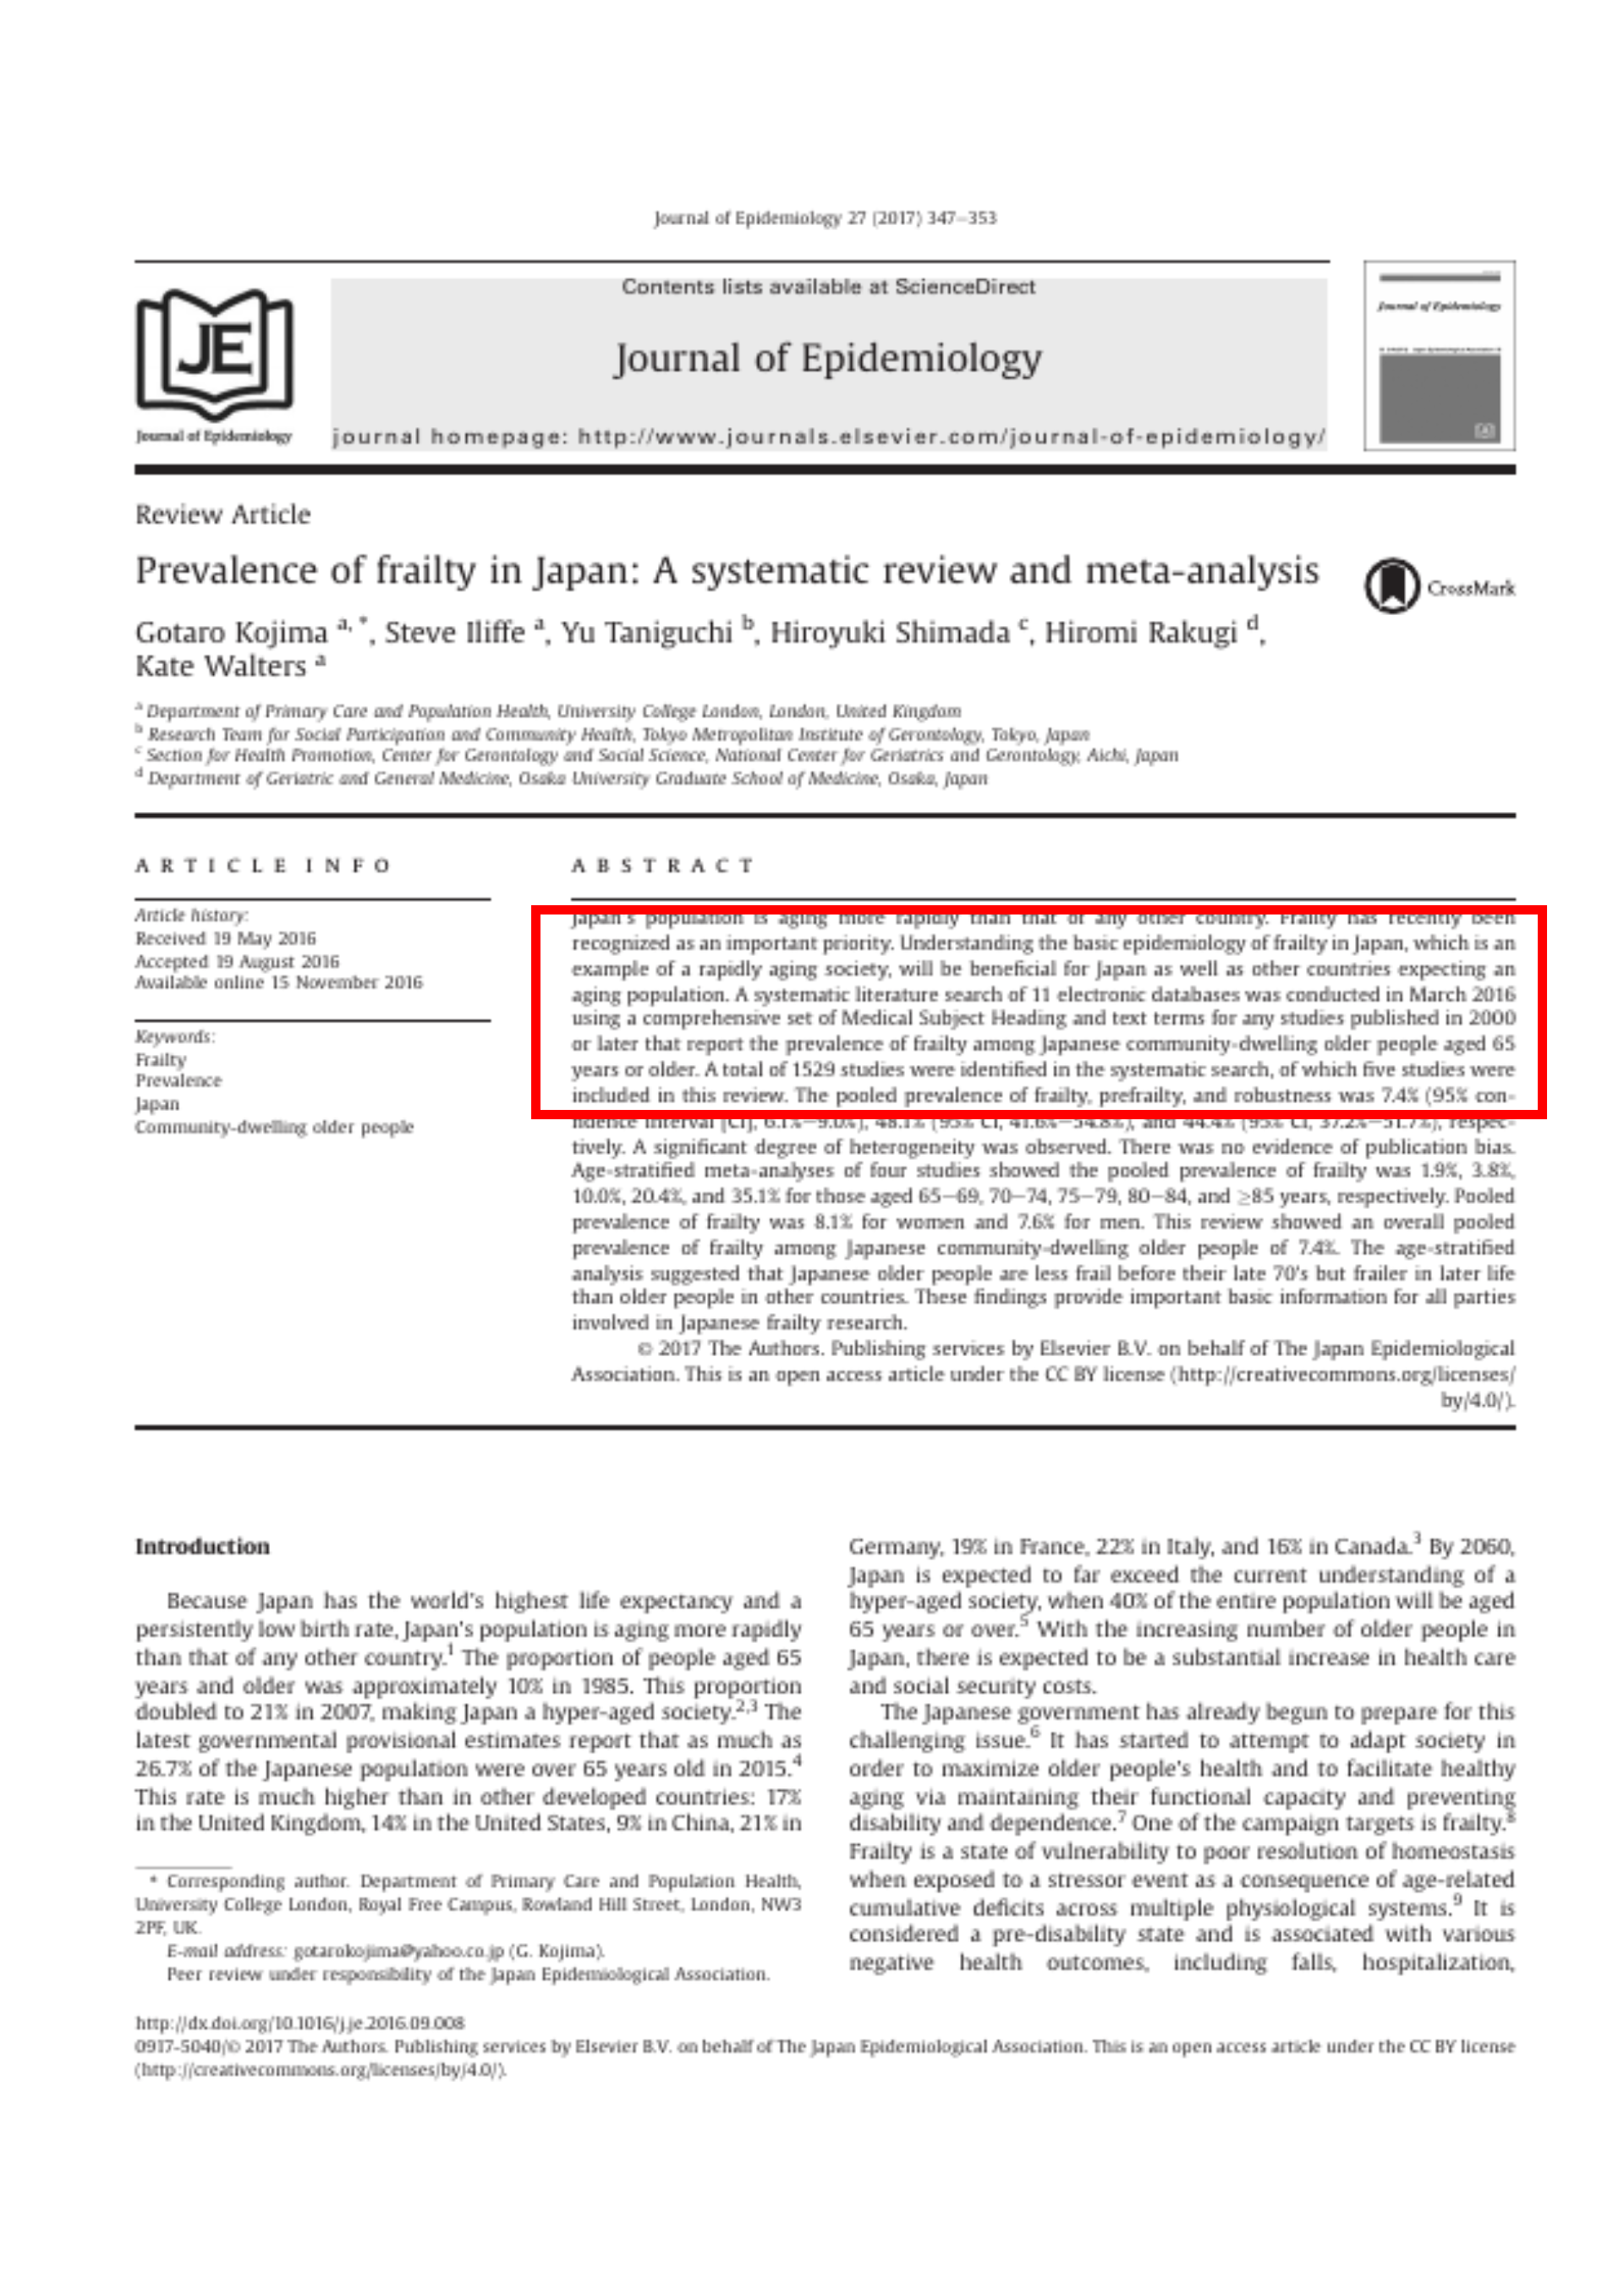
… The
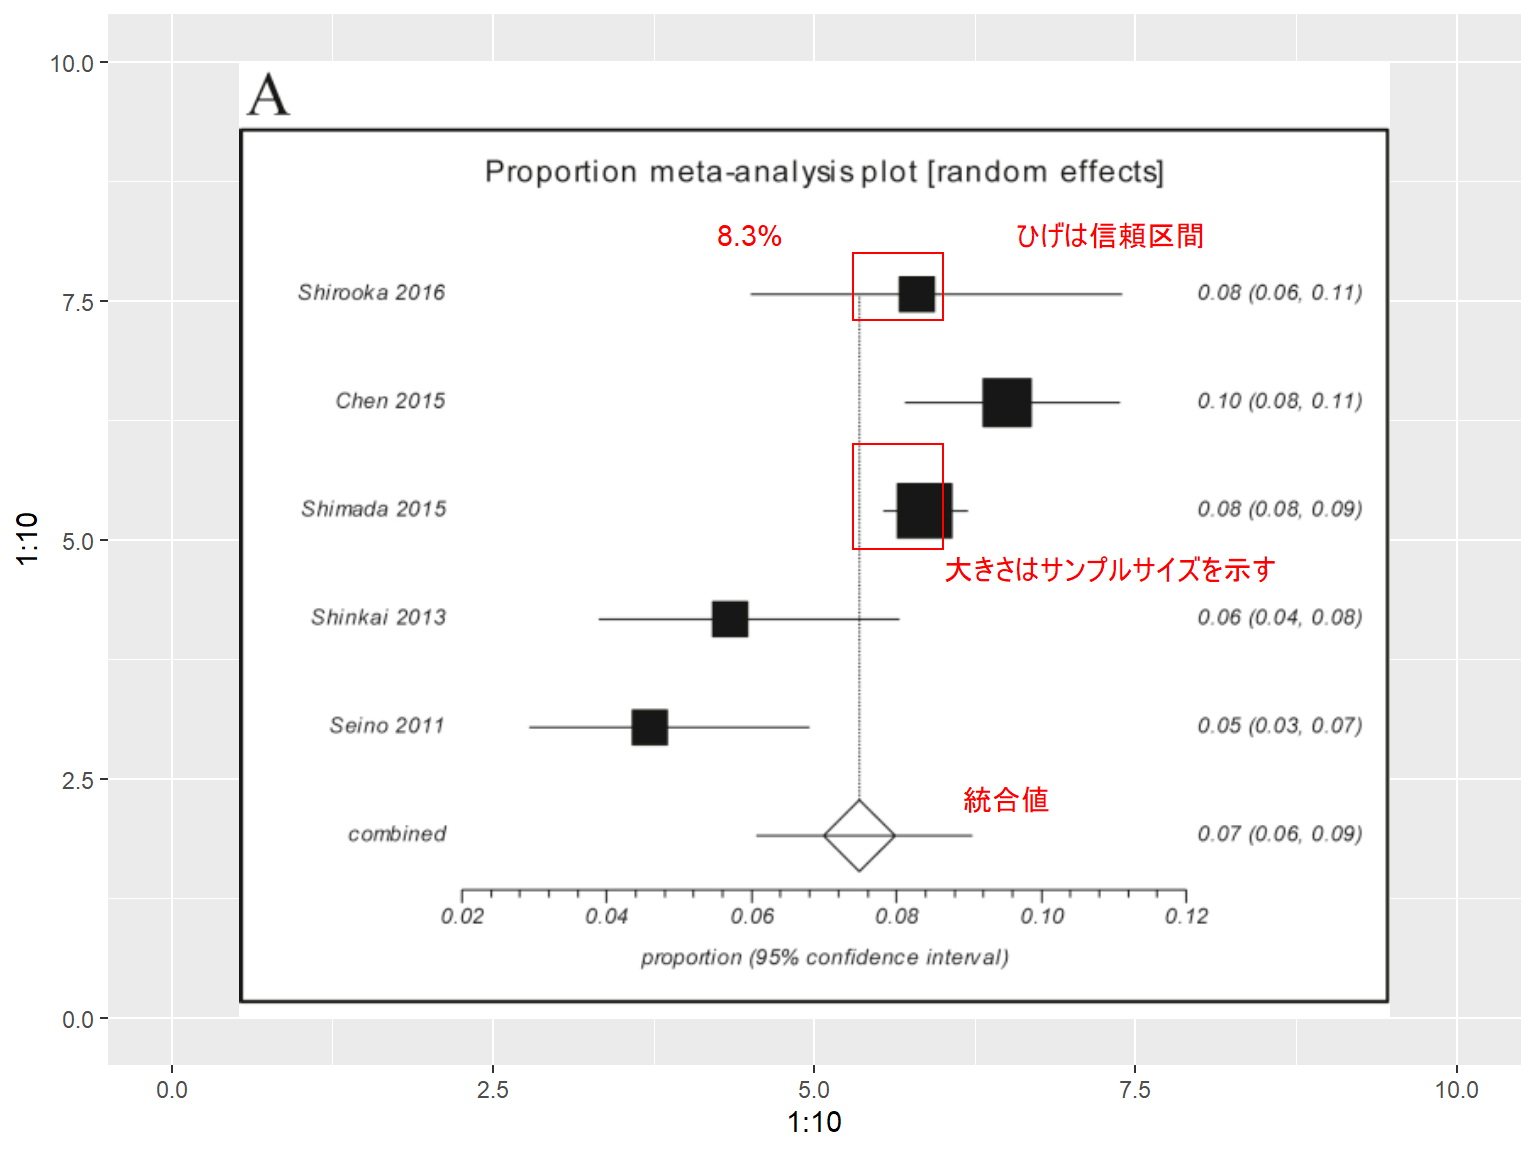
- フレイル、プレフレイル、頑健 (robust)の統合有病率は、それぞれ7.4%(95%信頼区間[CI]、6.1~9.0%)、48.1%(95%CI、41.6~54.8%)、44.4%(95%CI、37.2~51.7%)
- 出版バイアスの証拠はなかった
- 日本の地域在住高齢者におけるフレイルの統合有病率は全体で7.4%
- 日本の高齢者は70歳代後半まではフレイルが少ないが、それ以降は他国の高齢者に比べてフレイルが多い
Introduction
Because Japan has the world’s highest
各国(イギリス、アメリカ、中国、ドイツ、フランス、イタリア、カナダなど)の高齢化率を報告している研究論文はどれか?
- H. Arai, Y. Ouchi, K. Toba, et al. Japan as the front-runner of super-aged societies: perspectives from medicine and medical care in Japan, Geriatr Gerontol Int, 15 (2015), pp. 673-687 (in Eng)
- K. Rockwood, X. Song, C. MacKnight, et al. A global clinical measure of fitness and frailty in elderly people, CMAJ, 173 (2005), pp. 489-495 in Eng
- G. Kojima, Prevalence of frailty in nursing homes: a systematic review and meta-analysis, J Am Med Dir Assoc, 16 (2015), pp. 940-945 (in Eng)
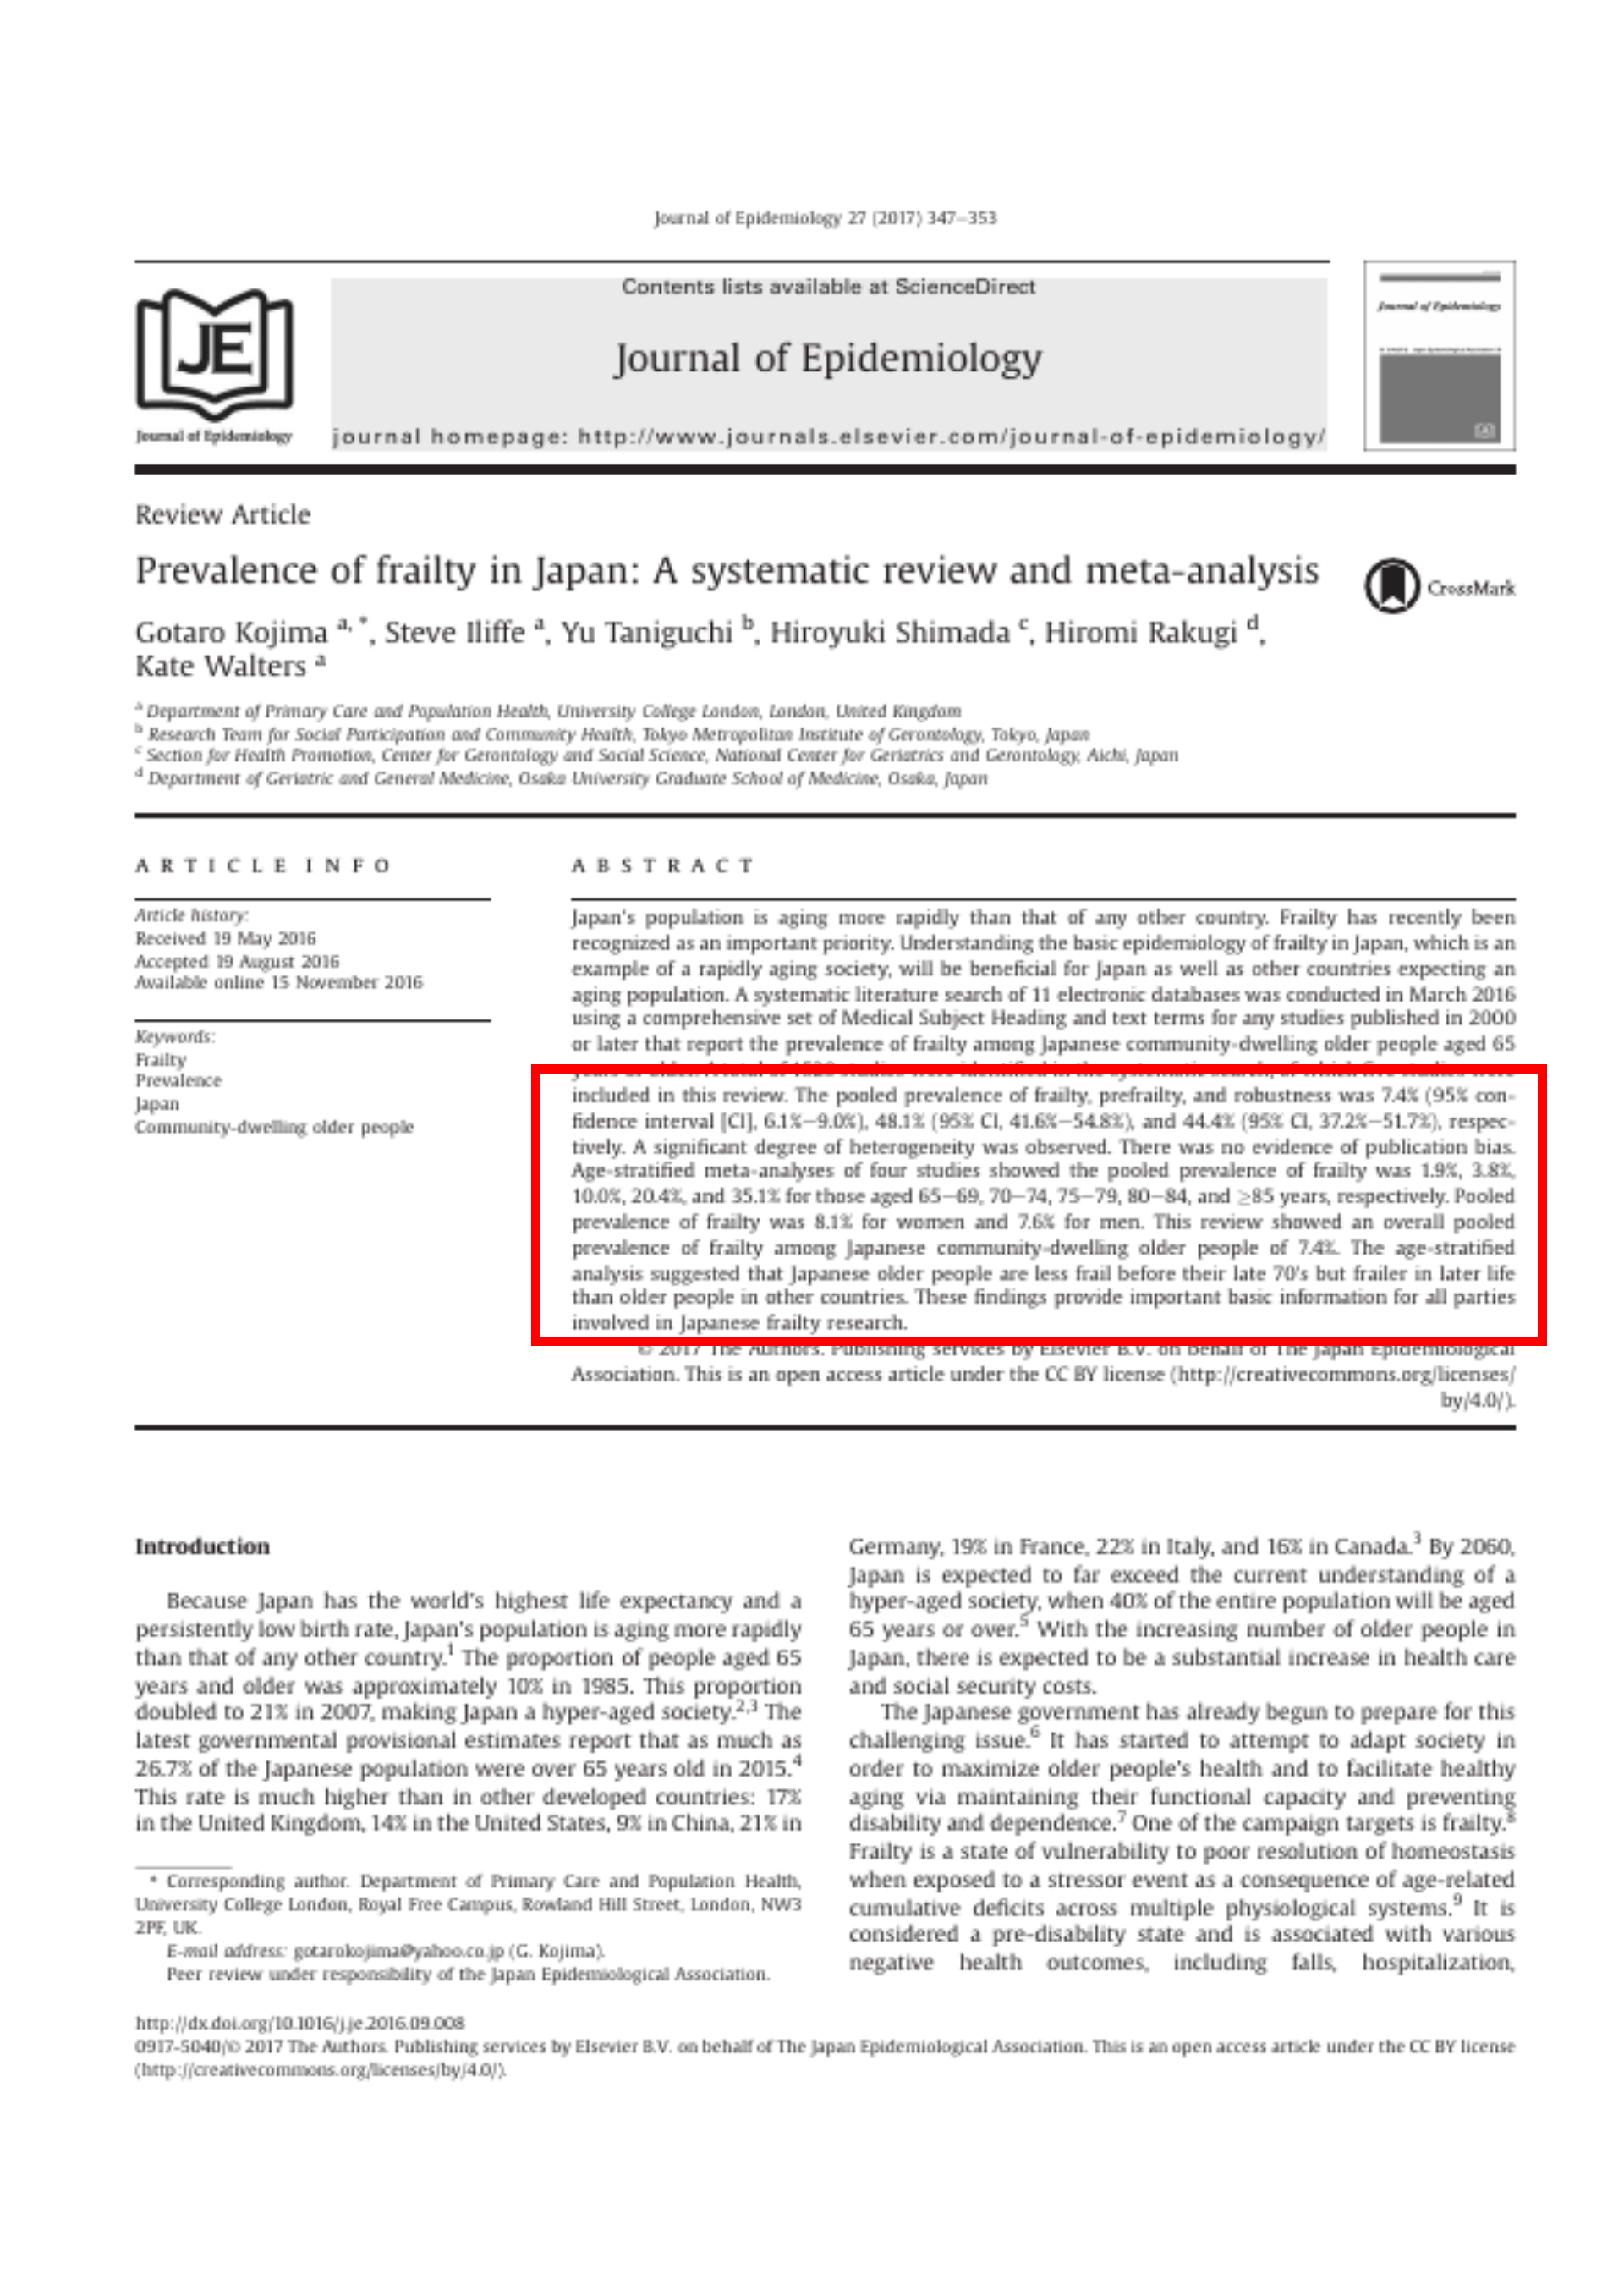
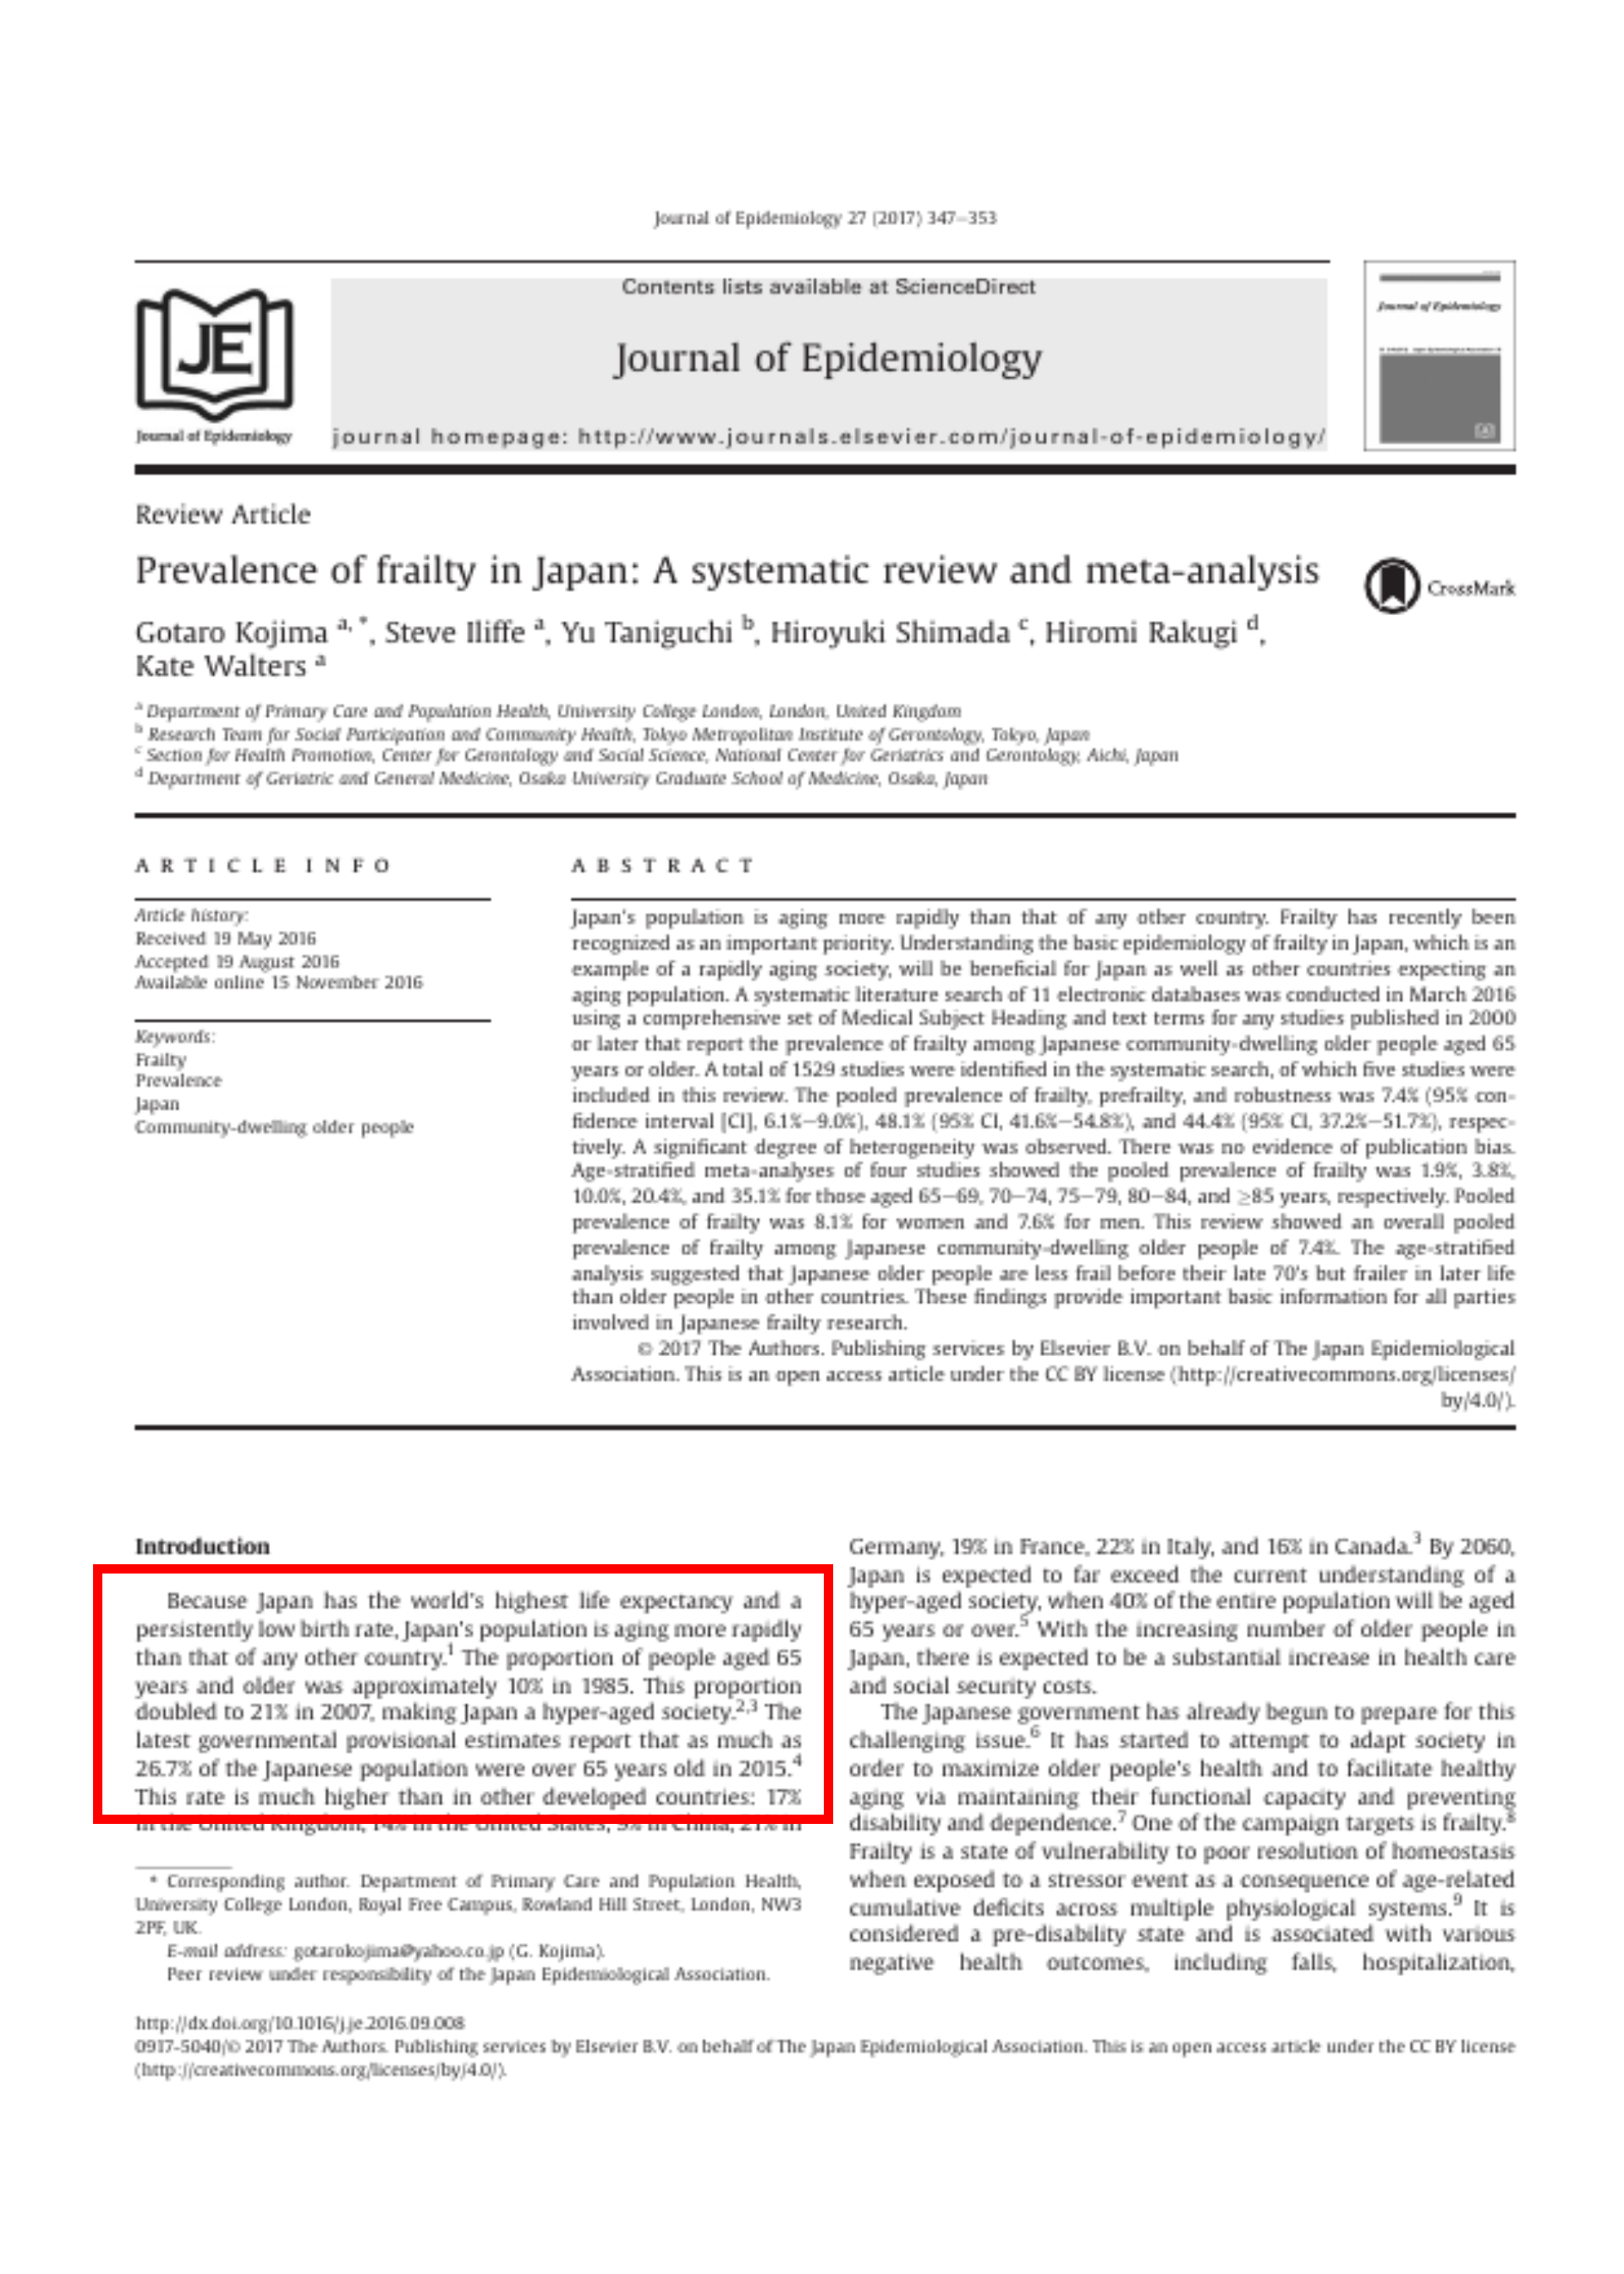
- 日本は世界一の長寿国であり、少子化が続いているため、他のどの国よりも急速に高齢化が進んでいる。1
- 政府の最新の暫定推計によると、2015年には日本の人口の26.7%が65歳以上となり、この割合は他の先進国よりはるかに高くなっている。4
- イギリス17%、アメリカ14%、中国9%、ドイツ21%、フランス19%、イタリア22%、カナダ16%と、他の先進国と比べてもかなり高い。3
- 2060年には、全人口の40%が65歳以上となる。5
- 1 H. Arai, Y. Ouchi, K. Toba, et al. Japan as the front-runner of super-aged societies: perspectives from medicine and medical care in Japan, Geriatr Gerontol Int, 15 (2015), pp. 673-687 (in Eng)
- 2 Ministry of Internal Affairs and Communications (Japan), Statistics Bureau, Japan Statistical Yearbook, Chapter 2 Population and Households [homepage on the Internet]; c2016. Available from:: http://www.stat.go.jp/english/data/nenkan/1431-02.htm.
- 3 K. Rockwood, X. Song, C. MacKnight, et al. A global clinical measure of fitness and frailty in elderly people, CMAJ, 173 (2005), pp. 489-495 in Eng
- 4 Ministry of Internal Affairs and Communications (Japan), Statistics Bureau, Provisional Estimates [homepage on the Internet]; c2016. Available from:: http://www.stat.go.jp/data/jinsui/pdf/201603.pdf.
- 5 National Institute of Population and Social Security Research (Japan), Population & Household Projection, Population Projection for Japan: 2011-2060, Summary of Population Trends [homepage on the Internet]; c2012. Available from:: http://www.ipss.go.jp/site-ad/index_english/esuikei/econ2.html.
disability: 障害
fall: 転倒
hospitalization: 入院
instituionalizaion: 施設入所
dementia: 認知症
quality of life: 生活の質
mortality: 死亡率
The Japanese government has already begun to prepare for this challenging issue.6 It has started to attempt to adapt society in order to maximize older people’s health and to facilitate healthy aging via maintaining their functional capacity and preventing
Quiz Fried et al. の frailty の基準は、別名として何と言われているか?
- KCL
- CHS 基準
- フレイルは、加齢に伴う複数の生理学的システムにわたる脆弱な状態。9
- 転倒、入院、施設収容、骨折、障害、認知症、生活の質の低下、死亡率と関連。9, 10, 11, 12, 13, 14, 15, 16
- 意図しない体重減少、疲労困憊、衰弱、歩行速度の低下、身体活動の低下という5つの身体的表現型要素を用いフレイルを定義 17
- Fried 基準では、構成要素5つのうち3以上をフレイル、1〜2をプレフレイル、0を頑健 (robust)と分類。17
- 6 Ministry of Health, Labour and Welfare (Japan) [homepage on the Internet]; c2015. Available from:: http://www.mhlw.go.jp/english/org/pamphlet/dl/pamphlet-about_mhlw.pdf.
- 7 N. Muramatsu, H. Akiyama Japan: super-aging society preparing for the future, Gerontologist, 51 (2011), pp. 425-432 (in Eng)
- 8 Ministry of Health, Labour and Welfare (Japan), 89th Social Security Council Medical Insurance Subcommittee Minutes (Japanese) [homepage on the Internet]; c2015. Available from: http://www.mhlw.go.jp/stf/shingi2/0000099462.html.
- 9 A. Clegg, J. Young, S. Iliffe, M.O. Rikkert, K. Rockwood Frailty in elderly people, Lancet, 381 (2013), pp. 752-762 (in Eng)
- 10 G. Kojima, Frailty as a predictor of future falls among community-dwelling older people: a systematic review and meta-analysis J Am Med Dir Assoc, 16 (2015), pp. 1027-1033 (in Eng)
- 11 G. Kojima, Frailty as a predictor of hospitalisation among community-dwelling older people: a systematic review and meta-analysis, J Epidemiol Community Health, 70 (2016), pp. 722-729 (in Eng)
- 12 G. Kojima, Frailty as a predictor of fractures among community-dwelling older people: a systematic review and meta-analysis, Bone, 90 (2016), pp. 116-122 (in Eng)
- 13 G. Kojima, Frailty as a predictor of nursing home placement among community-dwelling older adults: a systematic review and meta-analysis, J Geriatr Phys Ther (2016) (in Eng)
- 14 G. Kojima, Frailty as a predictor of disabilities among community-dwelling older people: a systematic review and meta-analysisDisabil Rehabil (2016)
- 15 , G. Kojima, Y. Taniguchi, S. Iliffe, K. Walters, Frailty as a predictor of Alzheimer disease, vascular dementia, and all dementia among community-dwelling older people: a systematic review and meta-analysis, J Am Med Dir Assoc, 17 (2016), pp. 881-888 (in Eng)
- 16 G. Kojima, S. Iliffe, S. Jivraj, K. Walters, Association between frailty and quality of life among community-dwelling older people: a systematic review and meta-analysis J Epidemiol Community Health, 70 (2016), pp. 716-721 (in Eng)
- 17 L.P. Fried, C.M. Tangen, J. Walston, et al., Frailty in older adults: evidence for a phenotype, J Gerontol A Biol Sci Med Sci, 56 (2001), pp. M146-M156 (in Eng)
page 348
intervention: 介入
outcome: アウトカム(スクリーニング等に使われる指標)
Given the detrimental physical and psychological impact of frailty on older people, as well as its potential reversibility,18, 19 frailty may be a promising target of
- フレイルは可逆であり、18, 19 有望な介入対象となりうる。9
- フレイルの基本疫学を理解することが不可欠である。22, 23
- 18 Lee J.S., Auyeung T.W., Leung J., Kwok T., Woo J. Transitions in frailty states among community-living older adults and their associated factors. J Am Med Dir Assoc. 2014;15:281–286. (in Eng)
- 19 Lanziotti Azevedo da Silva S., Campos Cavalcanti Maciel A., de Sousa Maximo Pereira L., Domingues Dias J.M., Guimaraes de Assis M., Correa Dias R. Transition patterns of frailty syndrome in comunity-dwelling elderly individuals: a longitudinal study. J Frailty Aging. 2015;4:50–55. (in Eng)
- 20 L. Ferrucci, J.M. Guralnik, S. Studenski, L.P. Fried, G.B. Cutler Jr., J.D. Walston Designing randomized, controlled trials aimed at preventing or delaying functional decline and disability in frail, older persons: a consensus report, J Am Geriatr Soc, 52 (2004), pp. 625-634, (in Eng)
- 21 F. Lally, P., Crome Understanding frailty, Postgrad Med J, 83 (2007), pp. 16-20, (in Eng)
- 22 J. Walston, E.C. Hadley, L. Ferrucci, et al., Research agenda for frailty in older adults: toward a better understanding of physiology and etiology: summary from the American geriatrics society/national Institute on aging research conference on frailty in older adults, J Am Geriatr Soc, 54 (2006), pp. 991-1001, (in Eng)
- 23 G. Berrut, S. Andrieu, I. Araujo de Carvalho, et al., Promoting access to innovation for frail old persons. IAGG (International Association of Gerontology and Geriatrics), WHO (World Health Organization) and SFGG (Societe Francaise de Geriatrie et de Gerontologie) Workshop–Athens January 20-21, 2012, J Nutr Health Aging, 17 (2013), pp. 688-693, (in Eng)
page 348
community-dwelling: 地域在住の
According to previous systematic reviews,24, 25 the prevalence of frailty based on the Fried criteria among
- これまでのシステマティックレビュー24, 25
- 米国の研究26 で4%
- スペインの研究27 で27.3%
患者の設定の区分
- hospitalized: 入院中の
- institutionalized: 施設入所中の
- community-dwelling: 地域在住の
- 24 R.M. Collard, H. Boter, R.A. Schoevers, R.C. Oude Voshaar, Prevalence of frailty in community-dwelling older persons: a systematic review, J Am Geriatr Soc, 60 (2012), pp. 1487-1492, (in Eng)
- 25 J. Choi, A. Ahn, S. Kim, C.W. Won, Global prevalence of physical frailty by Fried’s criteria in community-dwelling elderly with national population (in Eng)
- 26 P.M. Cawthon, L.M. Marshall, Y. Michael, et al., Frailty in older men: prevalence, progression, and relationship with mortality, J Am Geriatr Soc, 55 (2007), pp. 1216-1223 (in Eng)
- 27 B. Santos-Eggimann, P. Cuenoud, J. Spagnoli, J. Junod, Prevalence of frailty in middle-aged and older community-dwelling Europeans living in 10 countries, J Gerontol A Biol Sci Med Sci, 64 (2009), pp. 675-681 (in Eng)
systematic-review: 系統レビュー
meta-analysis: メタ分析
community-dwelling: 地域在住。入院や施設入所していないこと
pool: メタ分析などで、共通のアウトカムをもつ複数の研究のデータを統合して再解析すること
In other selected
The purposes of this
- 他の特定の集団では、フレイルの割合ははるかに高い
このシステマティックレビューとメタアナリシスの目的は、
- 日本の地域在住高齢者における身体的フレイルの有病率に関する利用可能な証拠を文献から系統的に検索すること
- およびフレイルの有病率をプールして統合するメタアナリシスを実施すること
- 28 C. Handforth, A. Clegg, C. Young, et al., The prevalence and outcomes of frailty in older cancer patients: a systematic review, Ann Oncol, 26 (2015), pp. 1091-1101 (in Eng)
- 29 G. Kojima, Prevalence of frailty in nursing homes: a systematic review and meta-analysis, J Am Med Dir Assoc, 16 (2015), pp. 940-945 (in Eng)
page 348
pool: 統合すること
mean: 平均(値)
proportion: 割合
subgroup: サブグループ。解析対象者を男女別、年齢区分別に分けて解析する際にサブグループ化する
meta-analysis: メタ分析
stratify: 層別化。サブグループを作る際に行うこと
In general, people become frailer with age and females are more likely to be frailer than their male counterparts.24 However, since Japan is unique in its longevity,30 universal health insurance system, healthy Japanese food, enhanced awareness about healthy aging among the general public, and the so-called Japanese smoking paradox (Japanese people smoke more but develop less lung cancer than people in Western countries), Japanese people may have different courses and patterns of frailty status than other populations. In addition, merely
Quiz サブグループを作成する際に使った手法は何か?
- stratification according to age and gender
- universal health insurance system
- 一般に、人は年齢とともにフレイルになり、女性は男性よりもフレイルになりやすい
- 日本人は他の集団とは異なる経過とパターンでフレイル状態になる可能性もある
- 年齢と性別で層別したメタ解析も行った
- 24 R.M. Collard, H. Boter, R.A. Schoevers, R.C. Oude Voshaar, Prevalence of frailty in community-dwelling older persons: a systematic review, J Am Geriatr Soc, 60 (2012), pp. 1487-1492, (in Eng)
- 30 L. Rodriguez-Manas, C. Feart, G. Mann, et al., Searching for an operational definition of frailty: a Delphi method based consensus statement: the frailty operative definition-consensus conference project, J Gerontol A Biol Sci Med Sci, 68 (2013), pp. 62-67 (in Eng)
Protocol
page 348
A protocol was developed according to the
- プロトコルは、他で発表されている。32
- Preferred Reporting Items for Systematic Review and Meta-Analysis (PRISMA) statement31
日本では、臨床研究実施計画・研究概要公開システム (jRCT) や、その他の臨床試験情報登録センター(JAPIC、JMACCT、UMINCTR)がある。
Quiz メタ分析の論文を作成する際に参照する声明は何か?
- PRISMA
- CONSORT
- 31 D. Moher, A. Liberati, J. Tetzlaff, D.G. Altman, Preferred reporting items for systematic reviews and meta-analyses: the PRISMA statement, 339 (2009), p. b2535 (in Eng)
- 32 PROSPERO International Prospective Register of Systematic Reviews, Prevalence of Frailty in Japan: A Systematic Review and Meta-analysis [homepage on the Internet]; c2016. Available from: http://www.crd.york.ac.uk/PROSPERO/display_record.asp?ID=CRD42016036112.
Data sources and search strategy
page 348
A systematic search of the literature was conducted in March 2015 for studies published in 2000 or later by
Quiz GK と YT とは何を指しているか?
- 著者 (Gotaro Kojima と Yu Taniguchi)
- Goal Keeper と Young Translator
- 2人の研究者(GK、YT)が10の電子データベースを用いて文献の系統的な検索を行った
- 研究は 65 歳以上の高齢者を対象とした原著論文に限定
- 本研究は人間を対象としないため、倫理的な承認は不要
Study selection and methodological quality assessment
page 348
Any studies providing or potentially capable of providing
Quiz cross-sectional の対義語は何か?
- trans-sectional
- longitudical
- 日本の65歳以上の地域住民を対象に
- Fried 基準またはその修正版で定義されたフレイル状態の有病率に関する横断的データを提供している
- 無作為化比較試験、総説、論説、コメントなどの研究は除外
- 内科学と老年医学のバックグラウンドを持つ臨床研究者(GK)が、タイトル、抄録、全文をスクリーニング
- Loney et al.33 のツールで、方法論の質について評価した。
- 33 P.L. Loney, L.W. Chambers, K.J. Bennett, J.G. Roberts, P.W. Stratford, Critical appraisal of the health research literature: prevalence or incidence of a health problem, Chronic Dis Can, 19 (1998), pp. 170-176 (in Eng)
Data extraction
page 348
The data collected directly from the included studies or provided by the authors upon request were first author’s name, cohort name if any, publication year, prefecture where the participants were recruited from, sample size, age (
Quiz proportion はどういう意味か?
- 体形
- 割合
- 筆頭著者名
- コホート名(ある場合)
- 発表年
- 参加者を募集した都道府県
- サンプルサイズ、年齢(平均値と範囲)
- 女性参加者の割合
- フレイルカテゴリー(フレイル、プレフレイル、頑健)
- 33 P.L. Loney, L.W. Chambers, K.J. Bennett, J.G. Roberts, P.W. Stratford, Critical appraisal of the health research literature: prevalence or incidence of a health problem, Chronic Dis Can, 19 (1998), pp. 170-176 (in Eng)
Statistical analysis
page 348
The numbers of the entire cohort, as well as those classified frail, prefrail, and robust, were used for analysis.
- 異質性は Cochran の Q 検定で評価し、p < 0.05 のとき異質性があるとした
- I2値が25%、50%、75%の場合はそれぞれ低、中、高度の異質性34 * 異質性がある場合はランダム効果モデル、異質性がない場合は固定効果モデル34
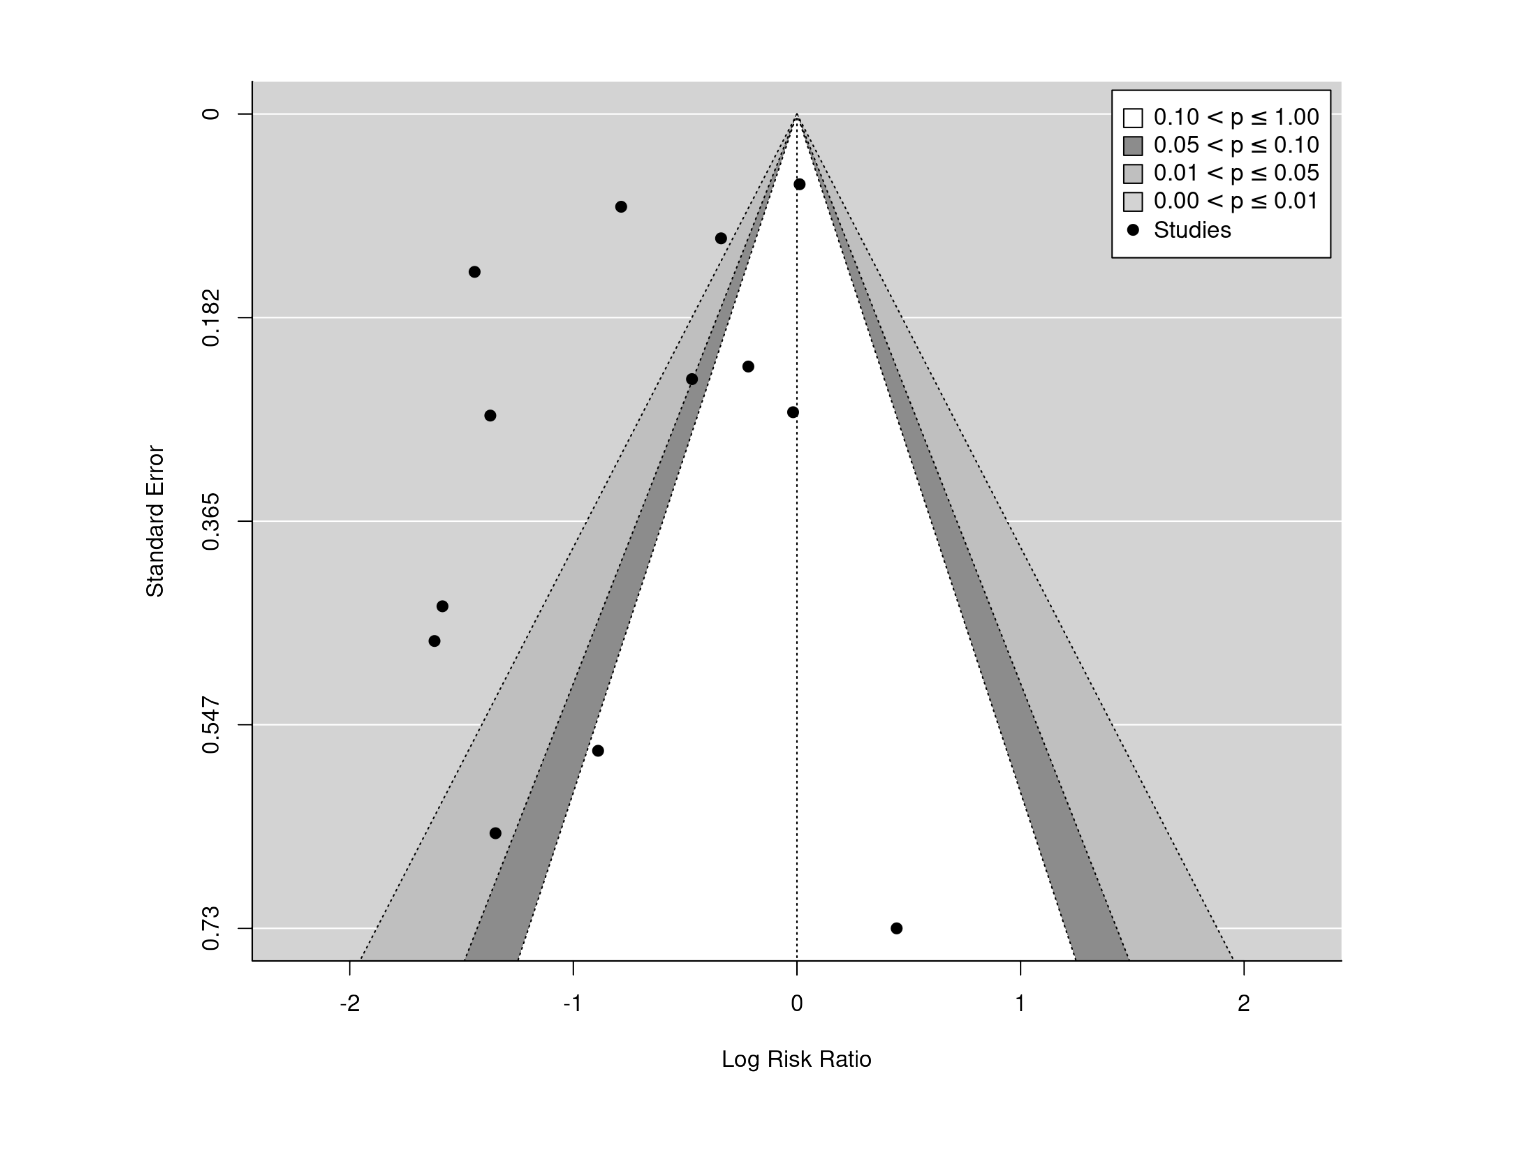
- 出版バイアスは、Begg-Mazumdar の検定35および Egger の検定36 を用い、ファネルプロットを目視で確認
- 34 J.P. Higgins, S.G. Thompson, J.J. Deeks, D.G. Altman, Measuring inconsistency in meta-analyses, BMJ, 327 (2003), pp. 557-560 (in Eng)
- 35 C.B. Begg, M. Mazumdar, Operating characteristics of a rank correlation test for publication bias, Biometrics, 50 (1994), pp. 1088-1101, (in Eng)
- 36 M. Egger, G. Davey Smith, M. Schneider, C. Minder, Bias in meta-analysis detected by a simple, graphical test, BMJ, 315 (1997), pp. 629-634 (in Eng)
Funnel plot
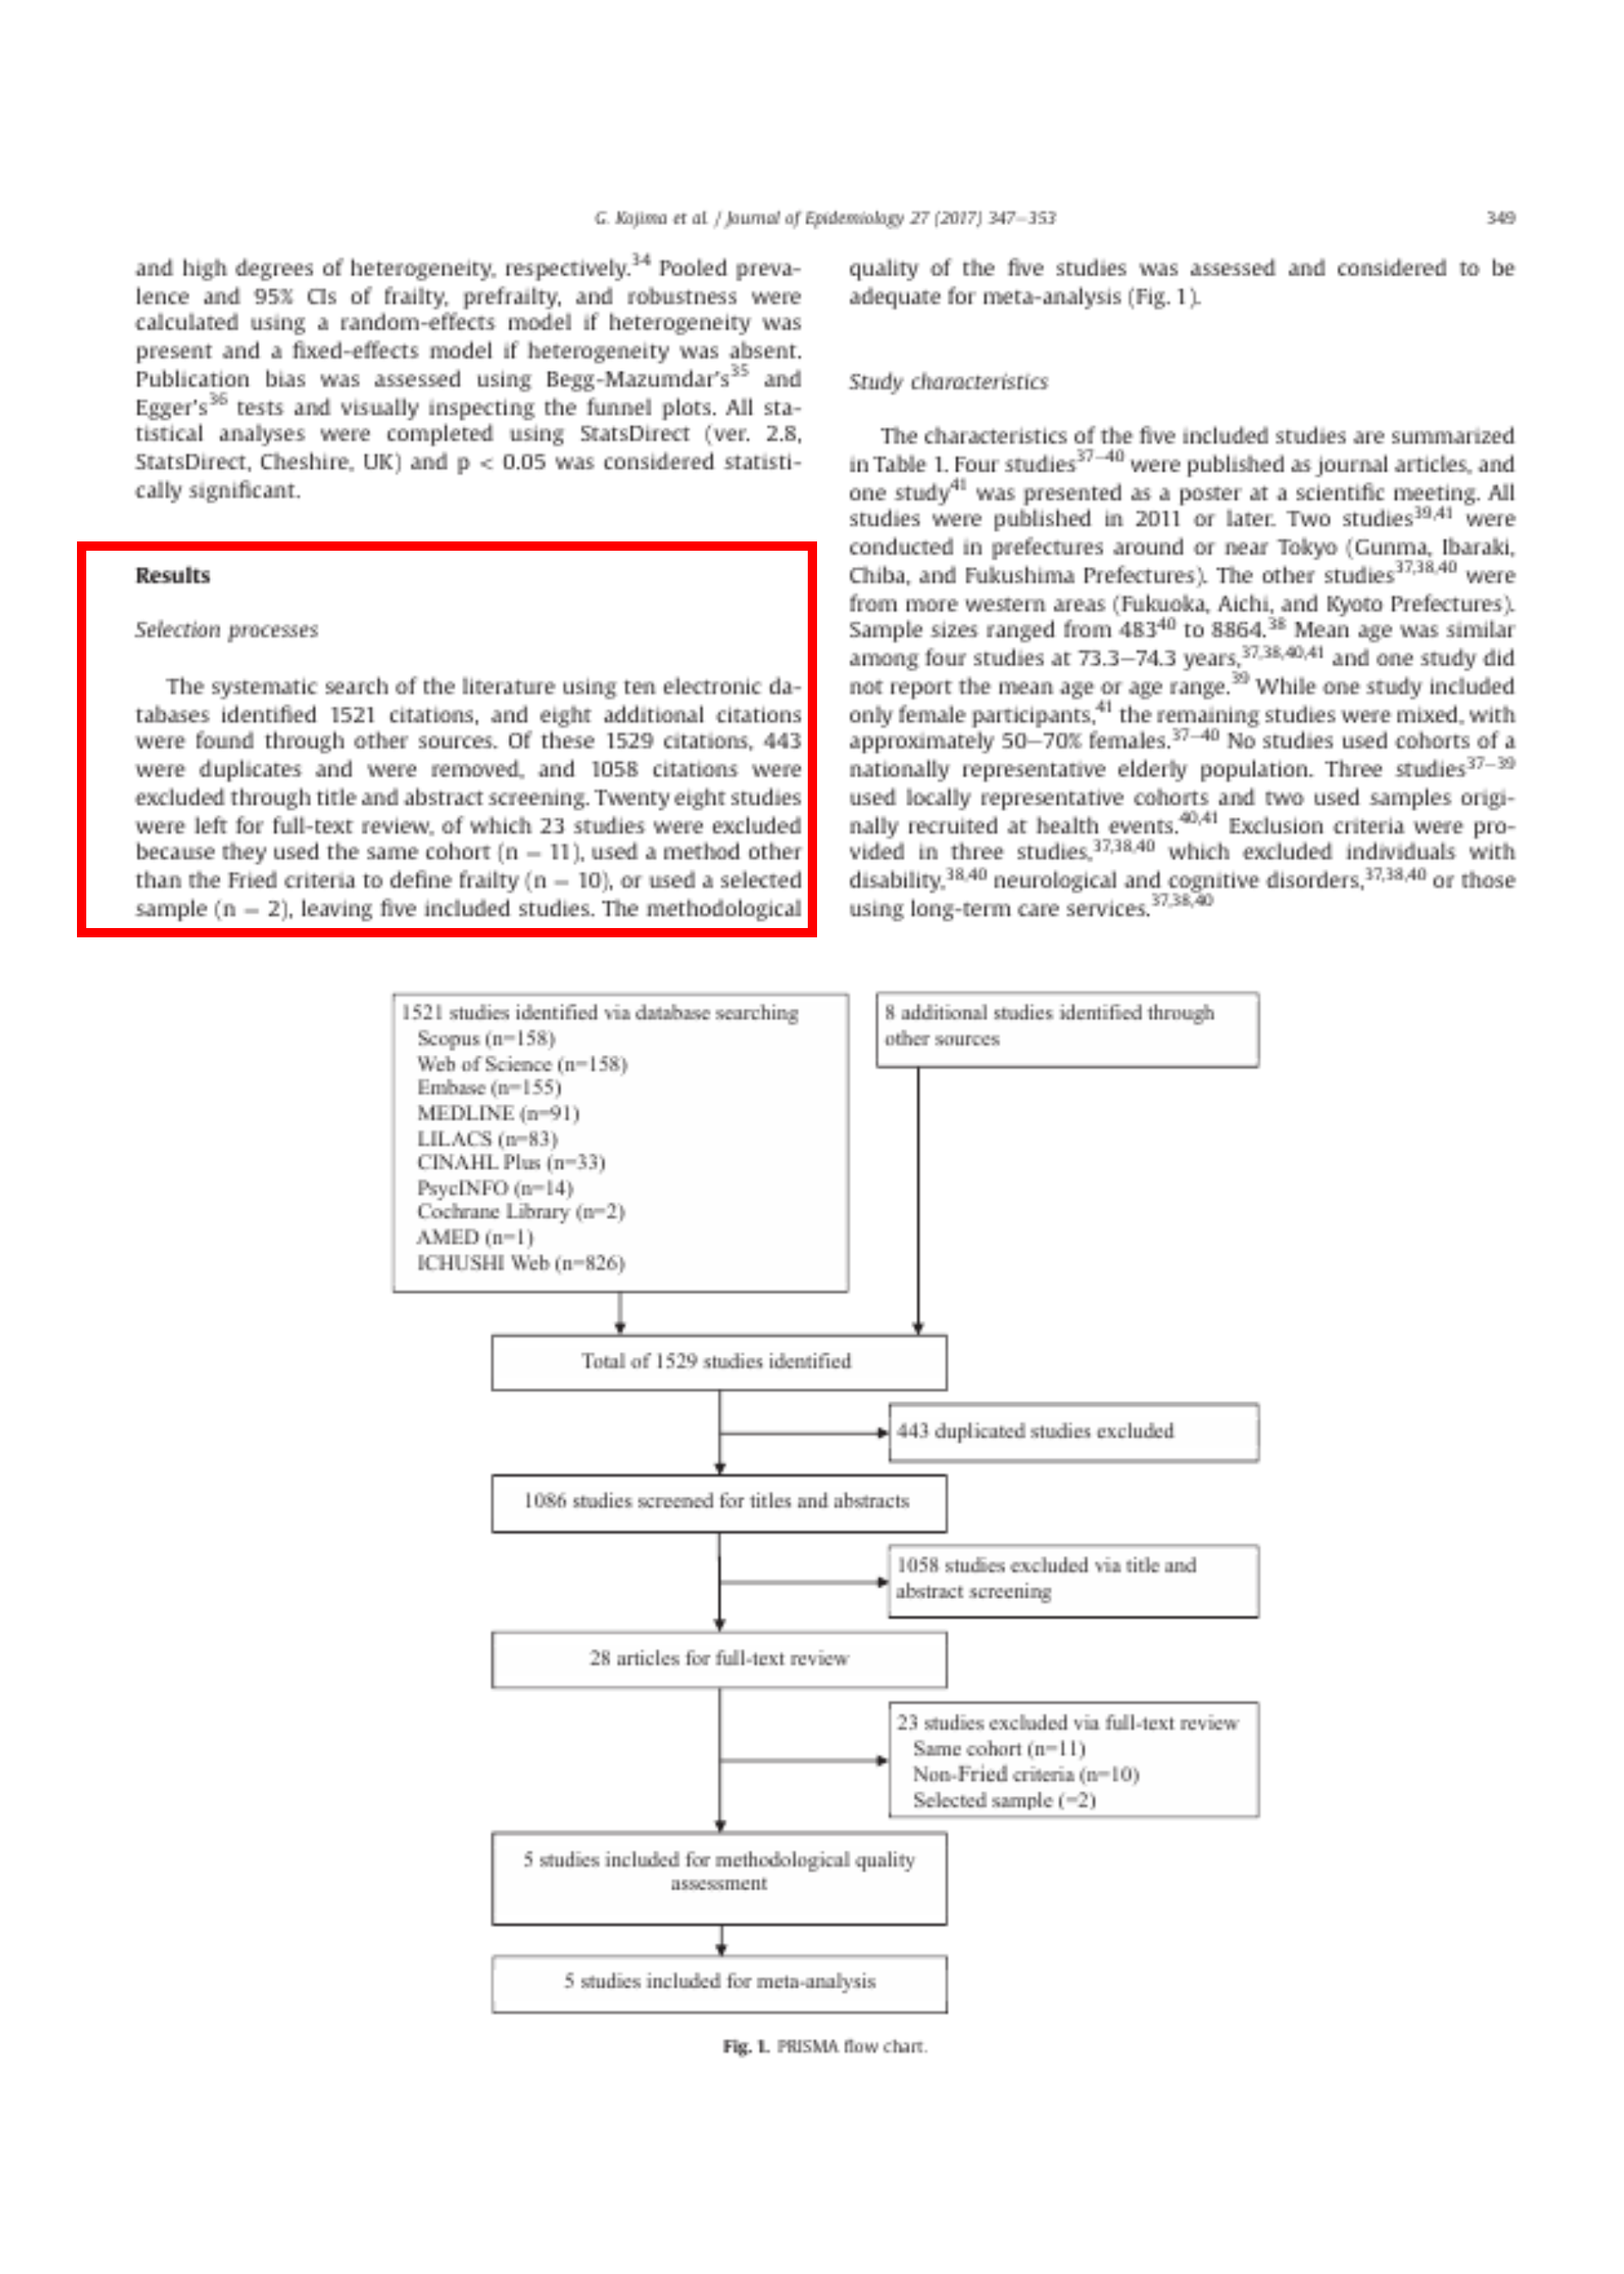
Selection processes
page 349
The systematic search of the literature using
- 34 J.P. Higgins, S.G. Thompson, J.J. Deeks, D.G. Altman, Measuring inconsistency in meta-analyses, BMJ, 327 (2003), pp. 557-560 (in Eng)
- 35 C.B. Begg, M. Mazumdar, Operating characteristics of a rank correlation test for publication bias, Biometrics, 50 (1994), pp. 1088-1101, (in Eng)
- 36 M. Egger, G. Davey Smith, M. Schneider, C. Minder, Bias in meta-analysis detected by a simple, graphical test, BMJ, 315 (1997), pp. 629-634 (in Eng)
著者らが論文全体を読んだのは何件か?
- 1529件
- 28件
- 5件
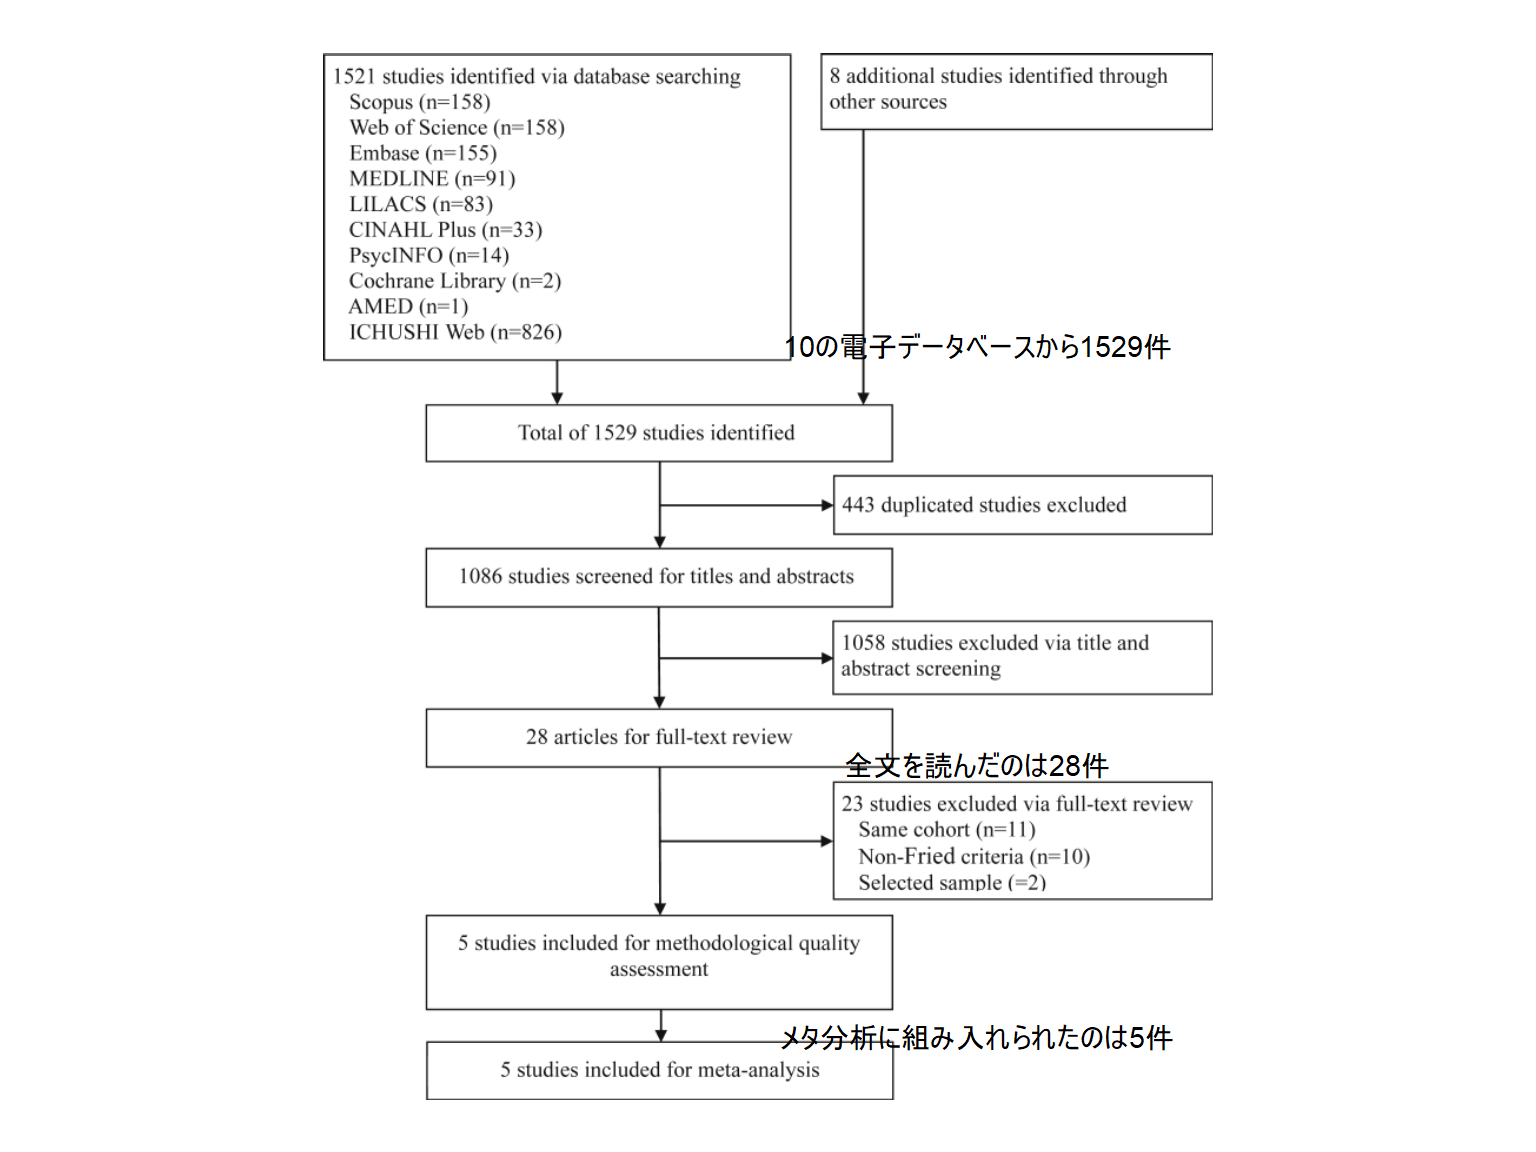
- 10の電子データベースを用いた文献の系統的検索
- 1529件の引用
- 443件は重複のため削除し、1058件はタイトルと抄録のスクリーニングにより除外
- 28件の研究が全文レビュー
- 23件は、同じコホートを使用している(n = 11)、フレイルの定義に Fried 基準以外の方法を使用している(n = 10)、または選択標本を使用している(n = 2)ため除外
- 5件の研究
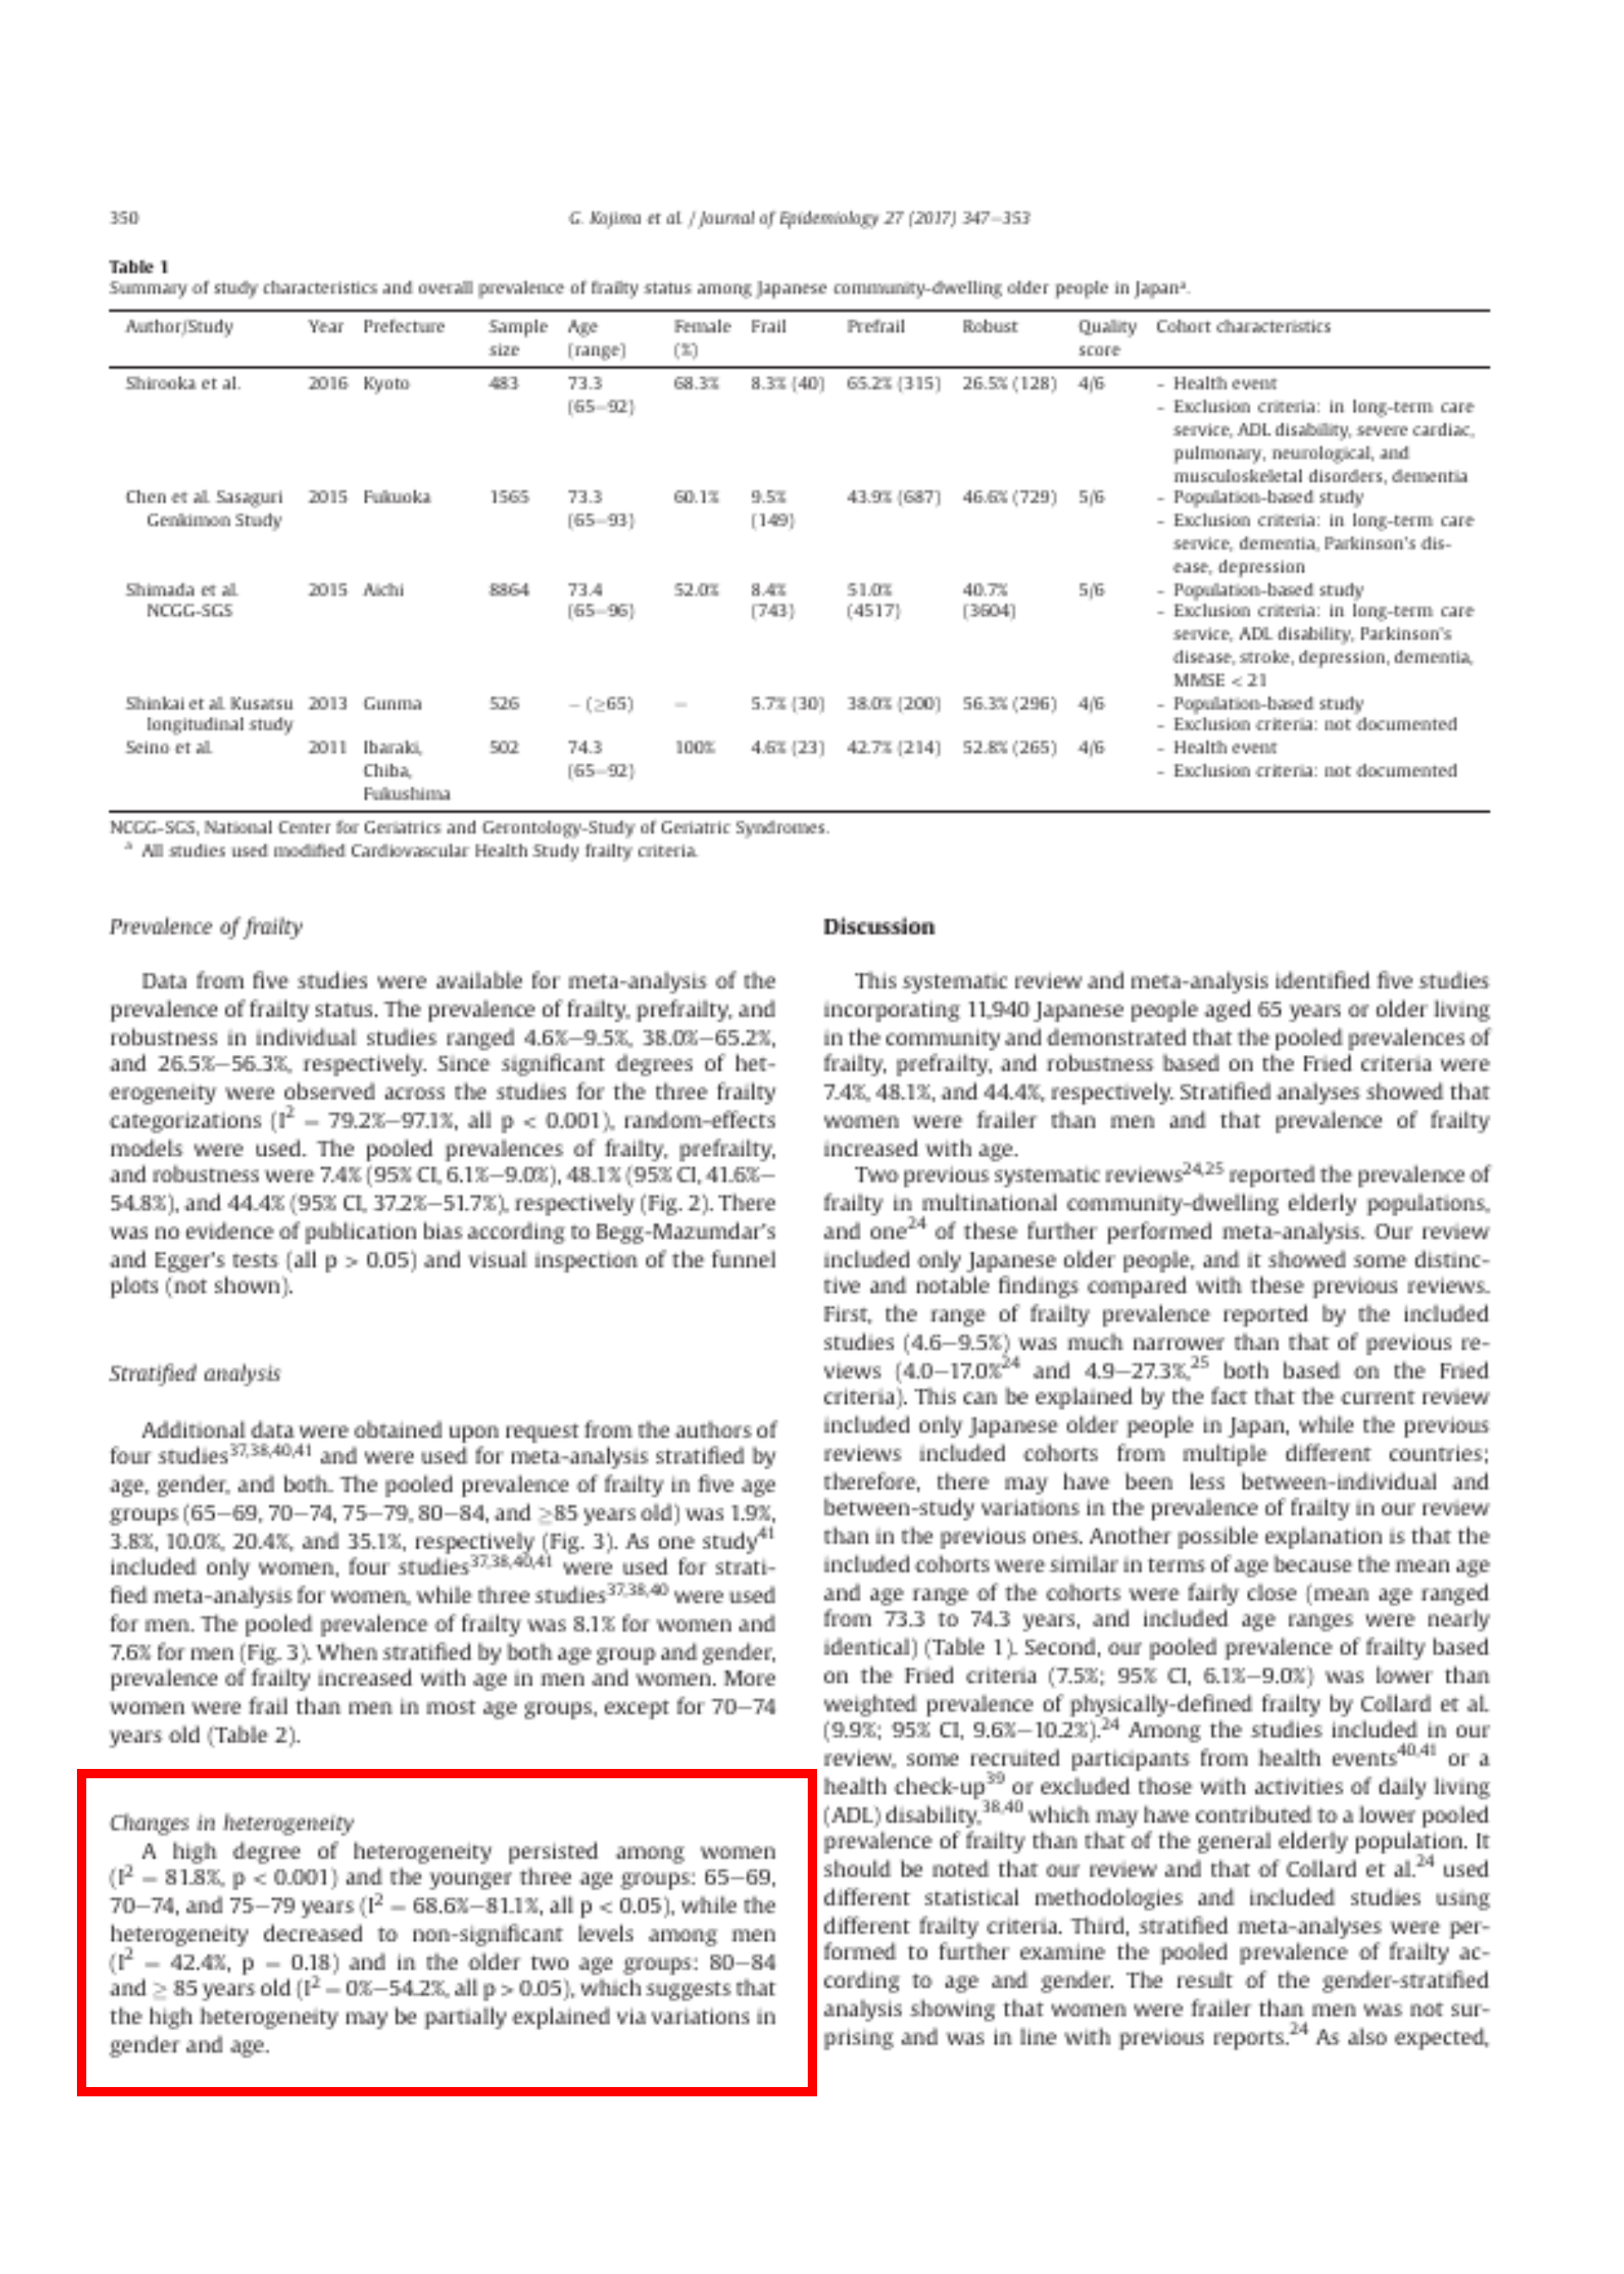
Study characteristics
page 349
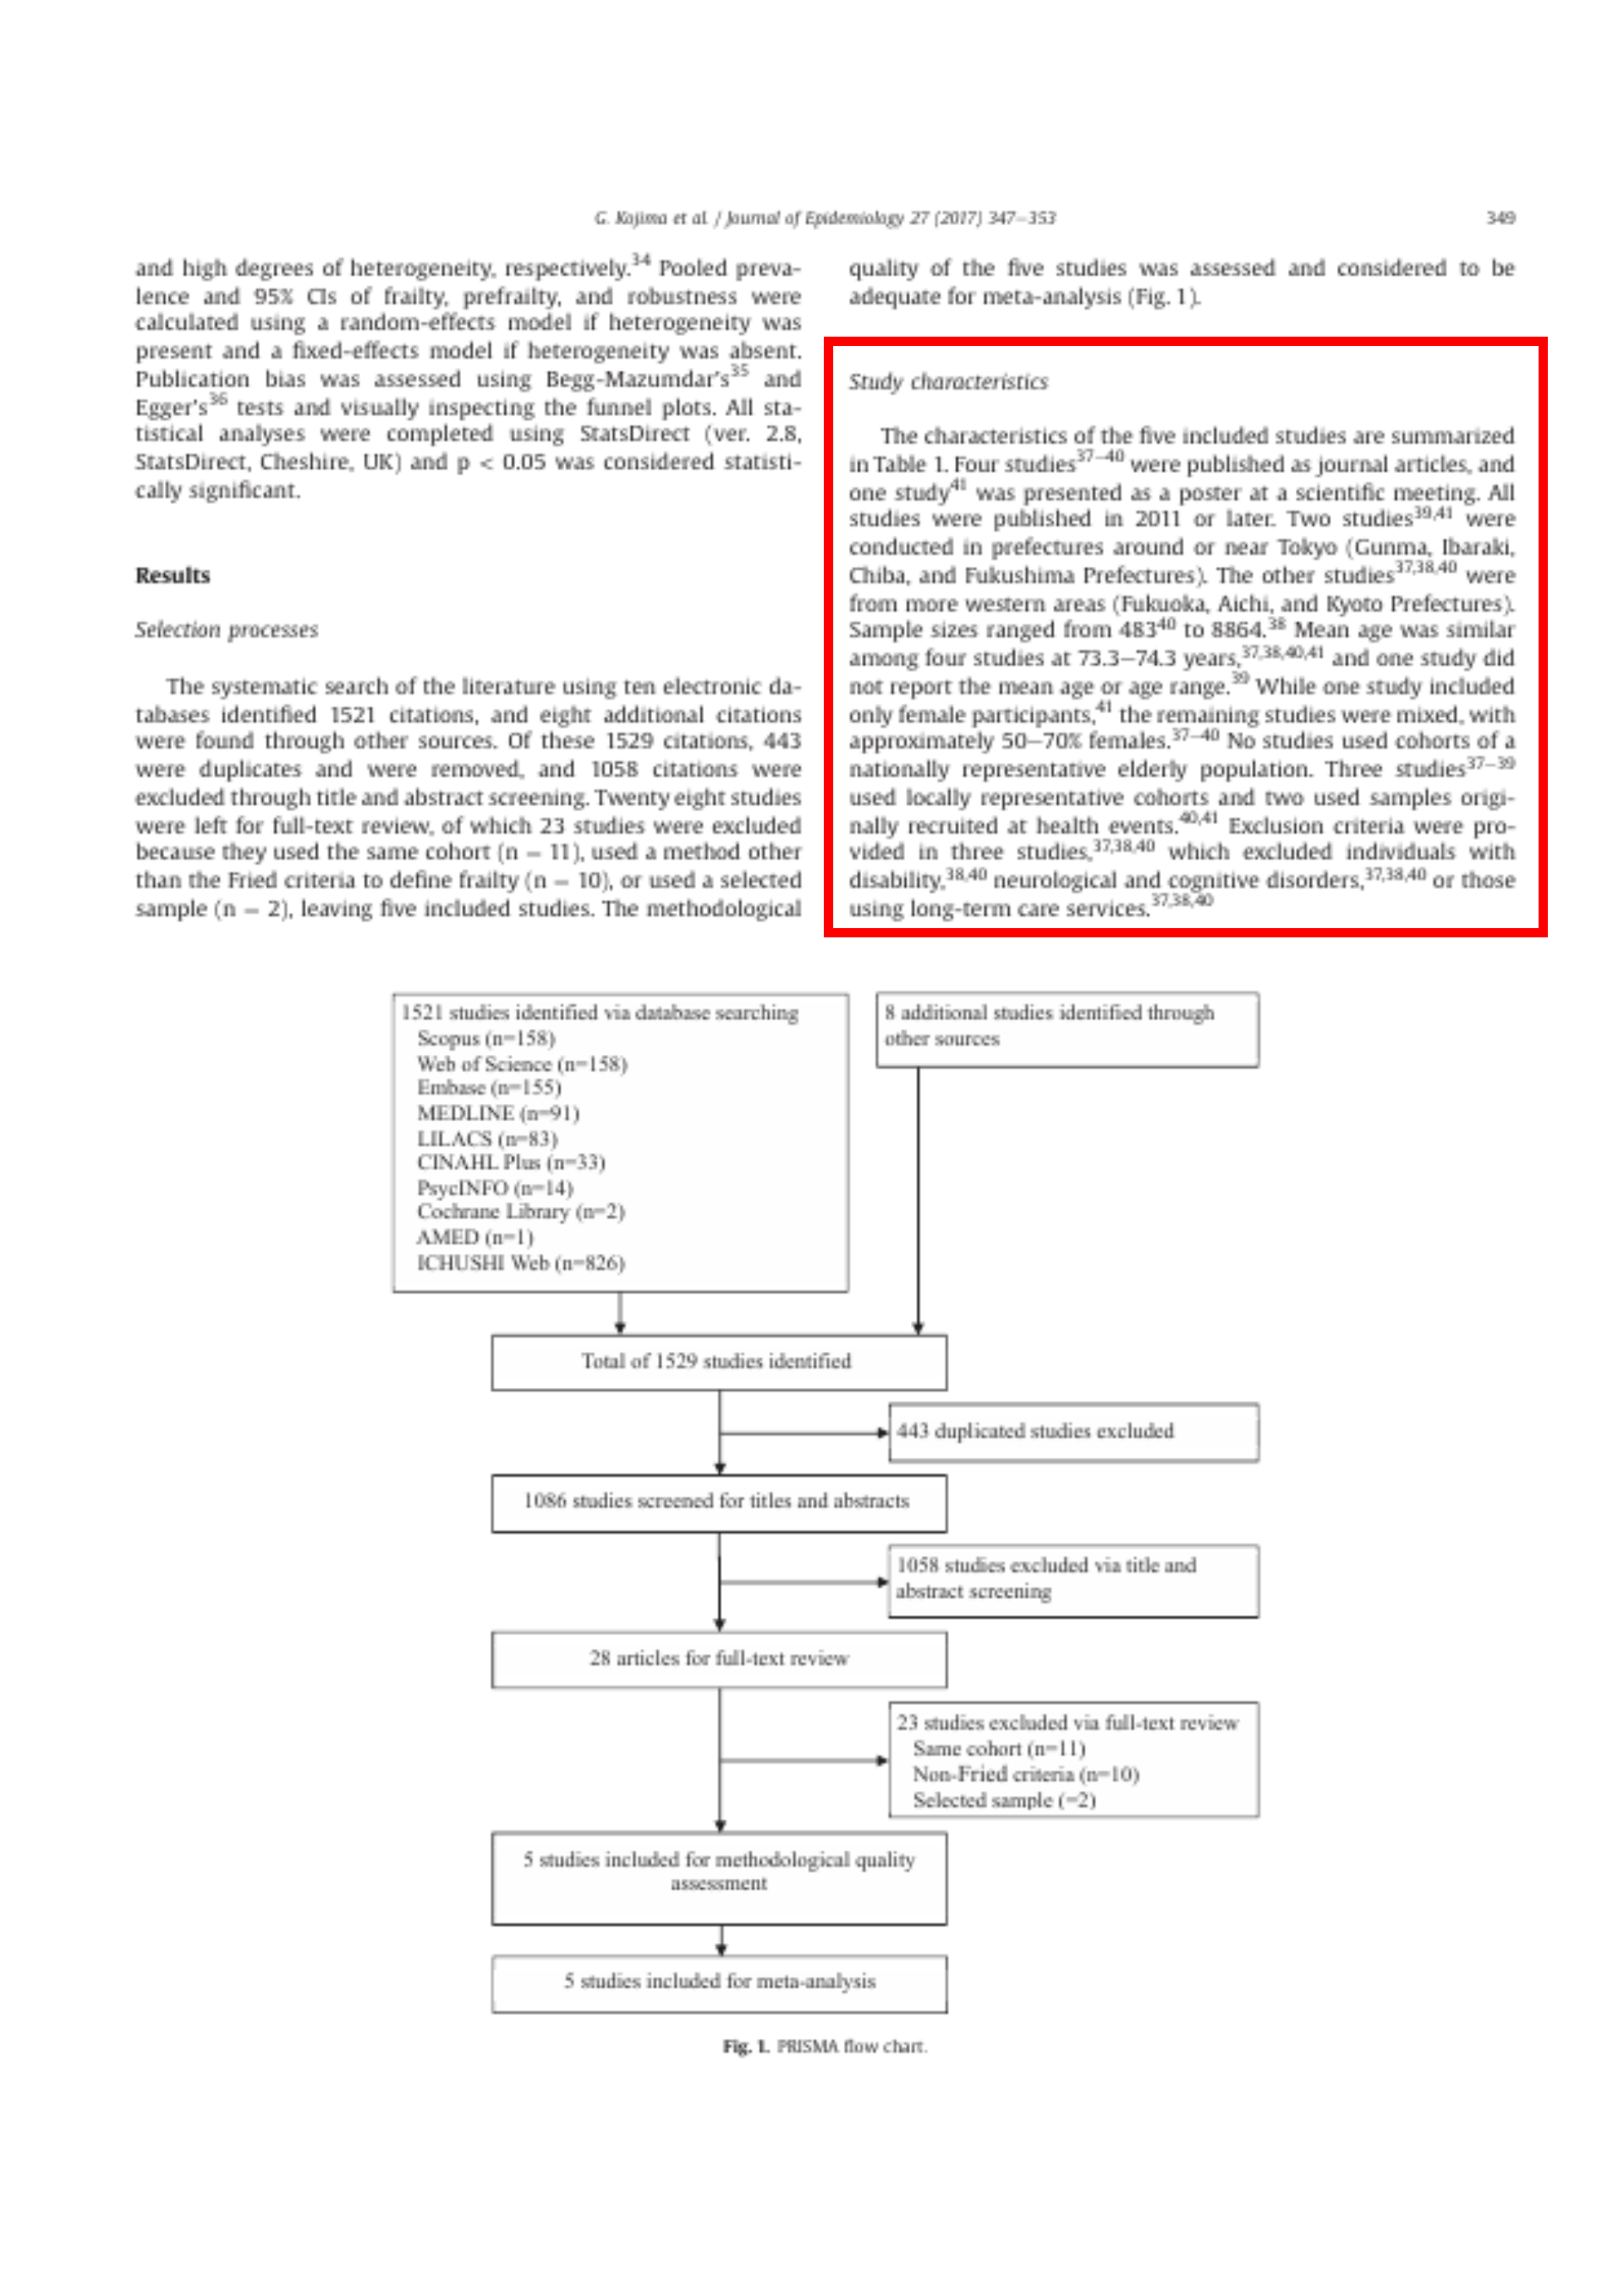
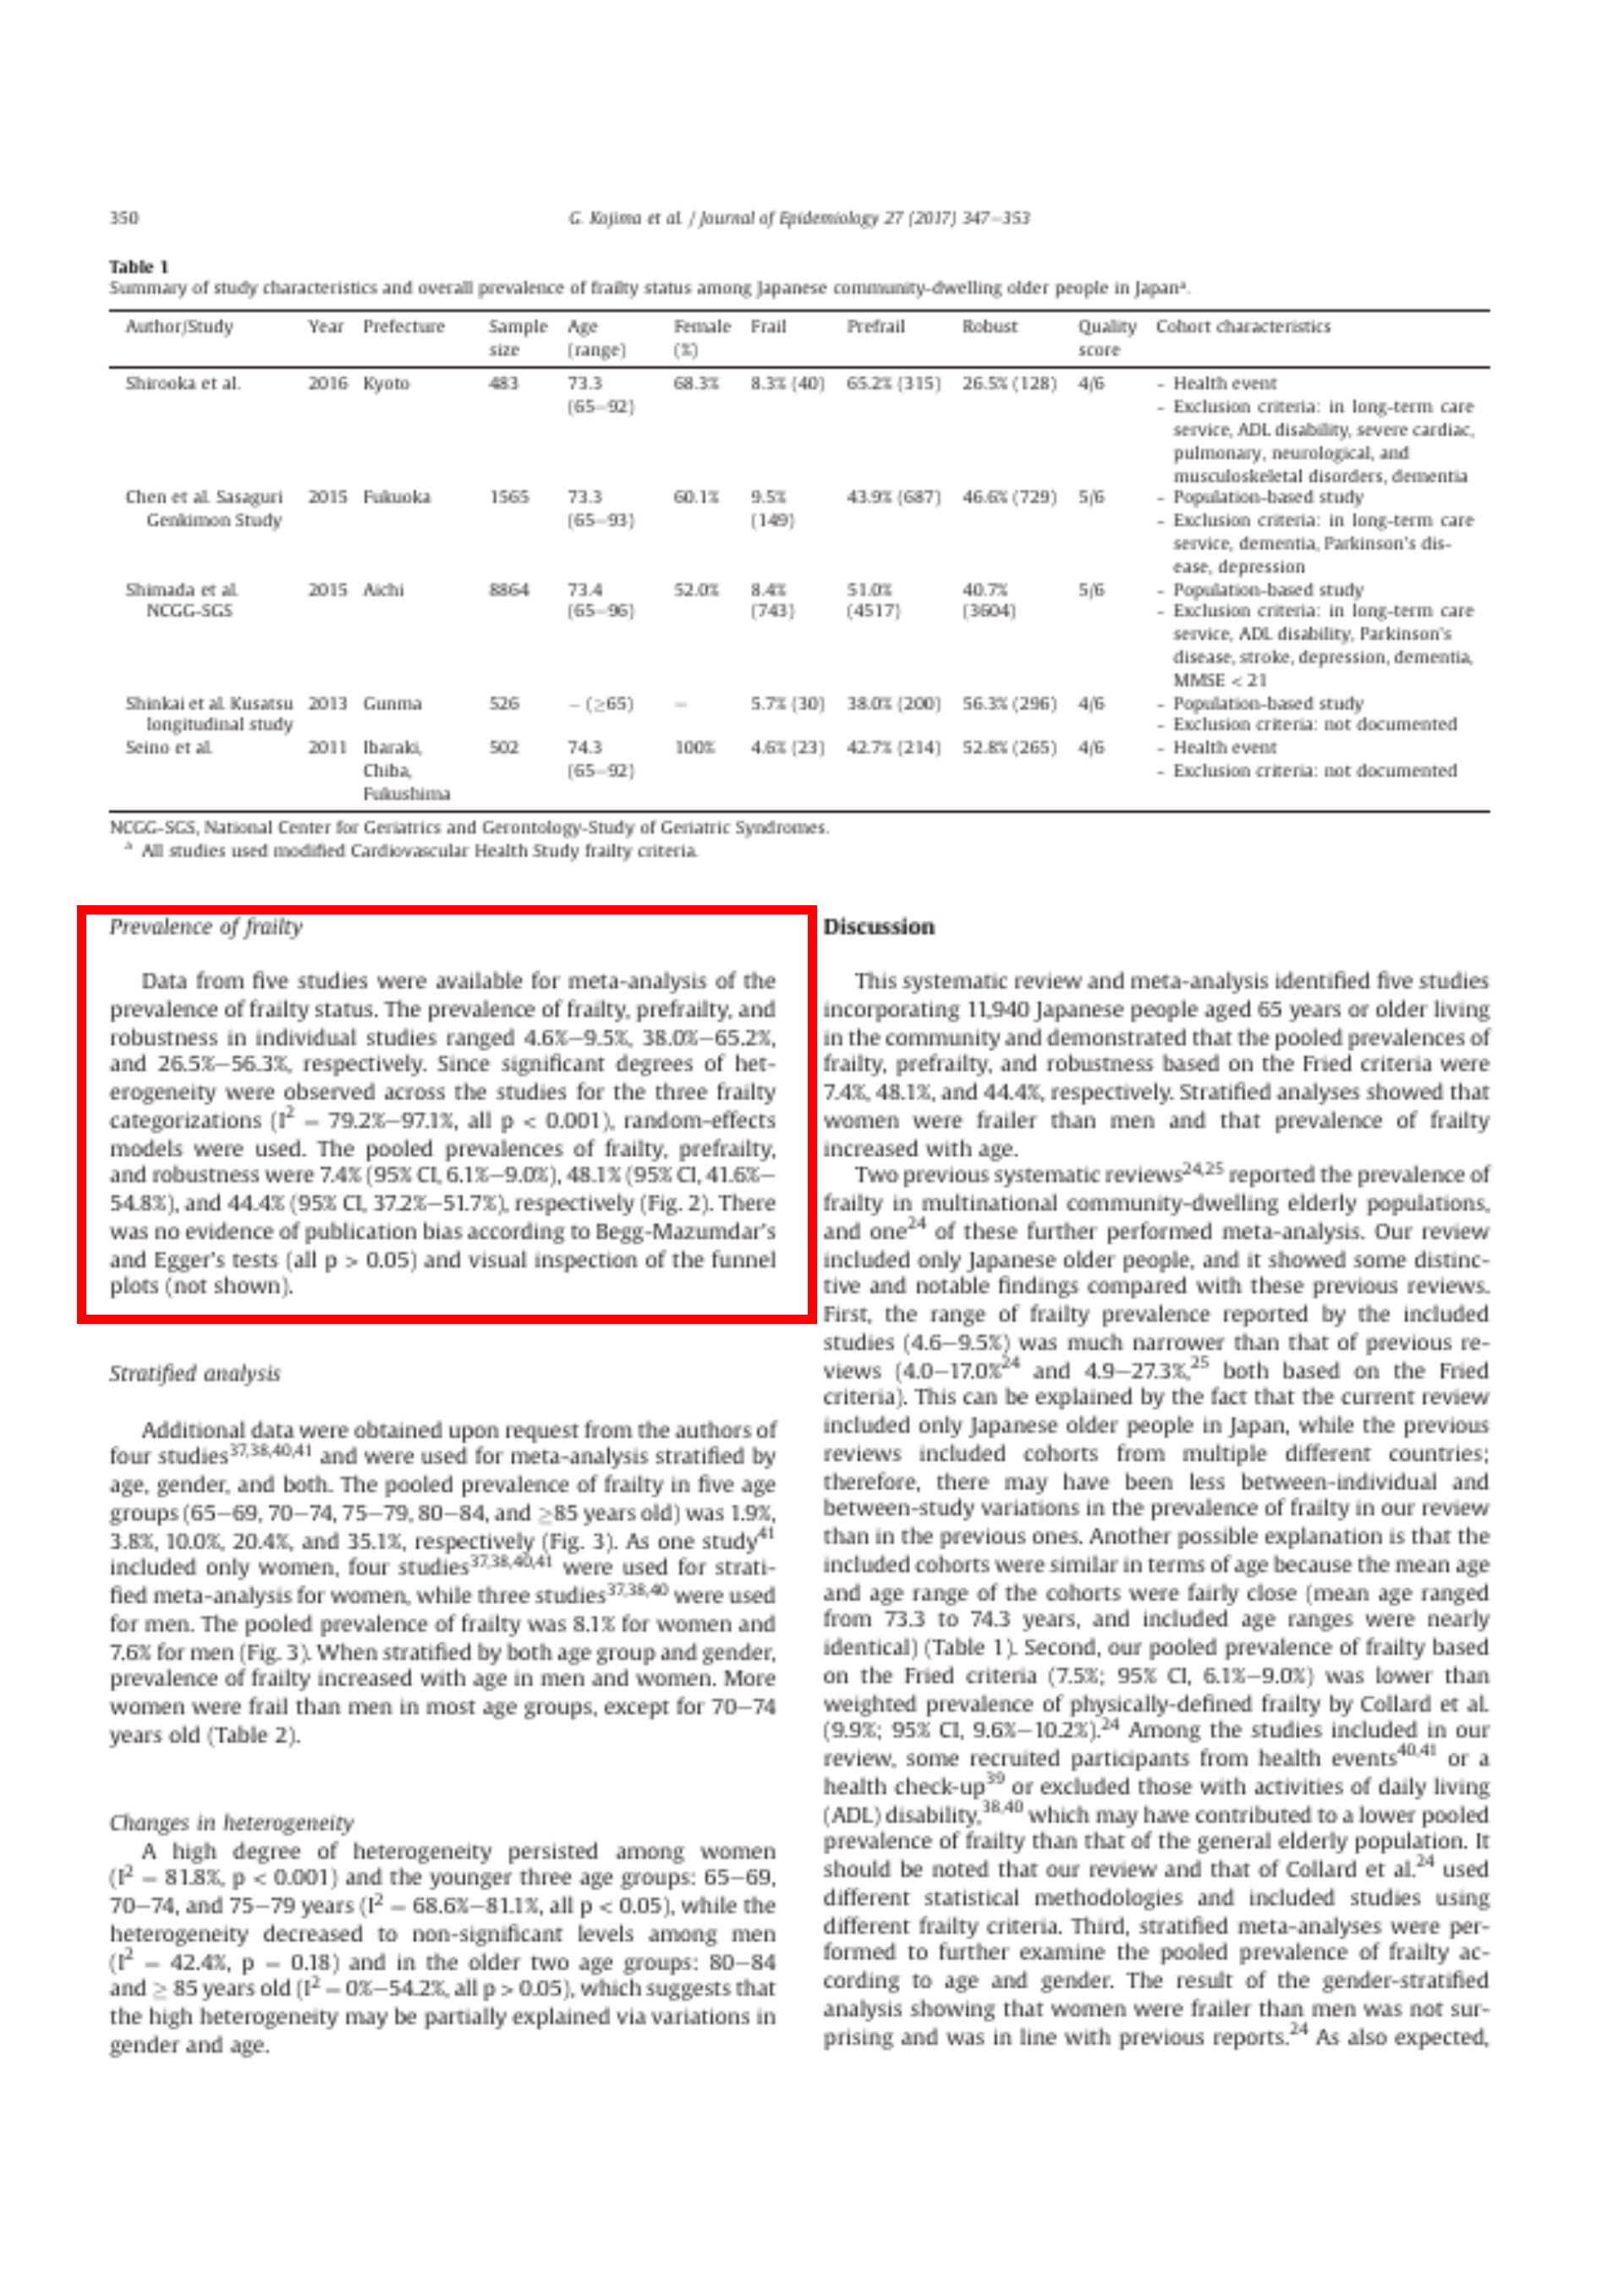
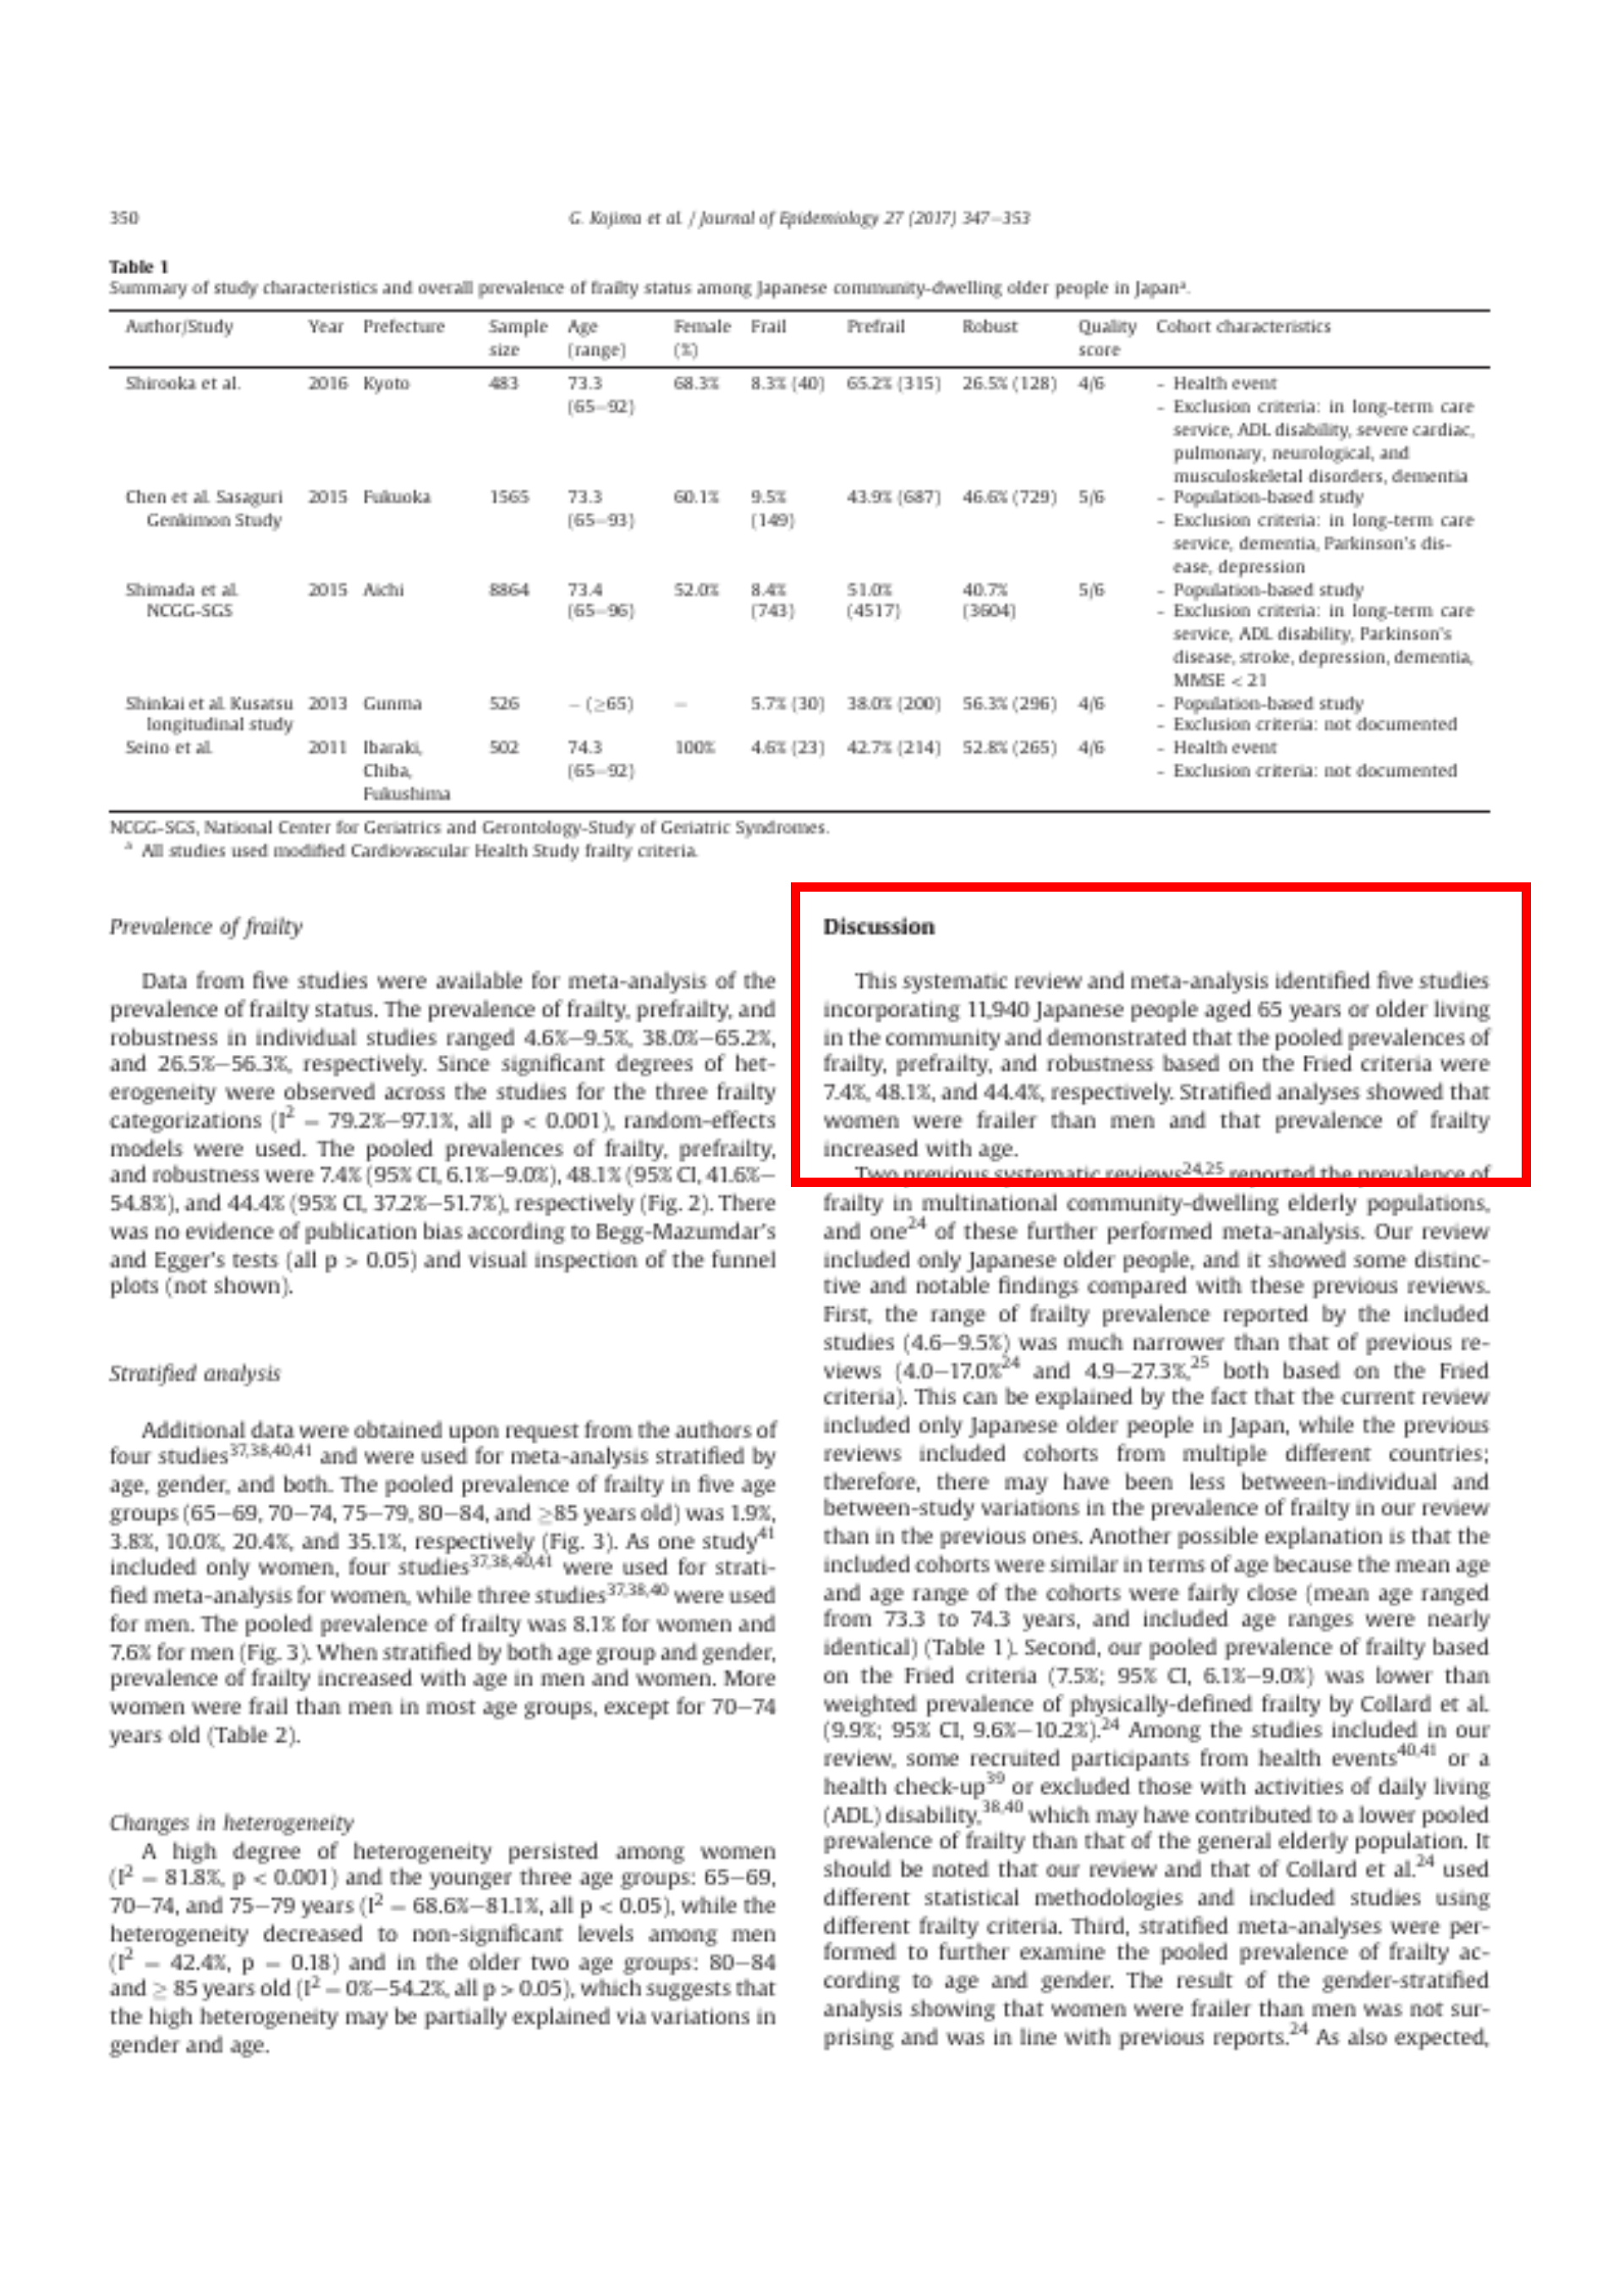
The characteristics of the five included studies are summarized in Table 1. Four studies37, 38, 39, 40 were published as journal articles, and one study41 was presented as a poster at a scientific meeting. All studies were published in 2011 or later. Two studies39, 41 were conducted in prefectures around or near Tokyo (Gunma, Ibaraki, Chiba, and Fukushima Prefectures). The other studies37, 38, 40 were from more western areas (Fukuoka, Aichi, and Kyoto Prefectures).
「5つの研究の ( ____ ) は、は48340から8864まであった。」空欄に当てはまるのは何か?
- サンプル数
- サンプルサイズ
- 2つの研究39, 41 は東京近郊の県(群馬県、茨城県、千葉県、福島県)、他の研究37, 38, 40 は、西の地域(福岡県、愛知県、京都府)
- サンプルサイズは48340から8864まであった。38
- 平均年齢は73.3-74.3歳と4つの研究でほぼ同じ
- 3件の研究37, 38, 39 は地域を代表するコホート
- 2件はもともと健康イベントで募集したサンプル
- 介護サービスを利用している人は除外37, 38, 40
- 37 S. Chen, T. Honda, K. Narazaki, T. Chen, Y. Nofuji, S. Kumagai, Global cognitive performance and frailty in non-demented community-dwelling older adults: findings from the Sasaguri Genkimon Study, Geriatr Gerontol Int, 16 (2016), pp. 729-736 (in Eng)
- 38 H. Shimada, H. Makizako, S. Lee, et al., Impact of cognitive frailty on daily activities in older persons, J Nutr health & aging (2016), pp. 1-7
- 39 S. Shinkai, N. Watanabe, H. Yoshida, et al., Validity of the “Kaigo-Yobo check-list” as a frailty index, Nihon Koshu Eisei Zasshi, 60 (2013), pp. 262-274 (in Jpn)
- 40 H. Shirooka, S. Nishiguchi, N. Fukutani, et al. Cognitive impairment is associated with the absence of fear of falling in community-dwelling frail older adults, Geriatr Gerontol Int (2016) (in Eng)
- 41 S. Seino, N. Yabushita, M-J. Kim, et al., Is upper extremity performance associated with frailty in community-dwelling older Women?: 2617: board# 225 June 3 9: 00 AM-10: 30 AM, Med Sci Sports Exerc, 43 (2011), pp. 723-724
| Study | Sample size | Frail |
|---|---|---|
| Shirooka | 483 | 8.3% |
| Chen | 1565 | 9.5% |
| Shimada | 8864 | 8.4% |
| Shinkai | 526 | 5.7% |
| Seino | 502 | 4.6% |
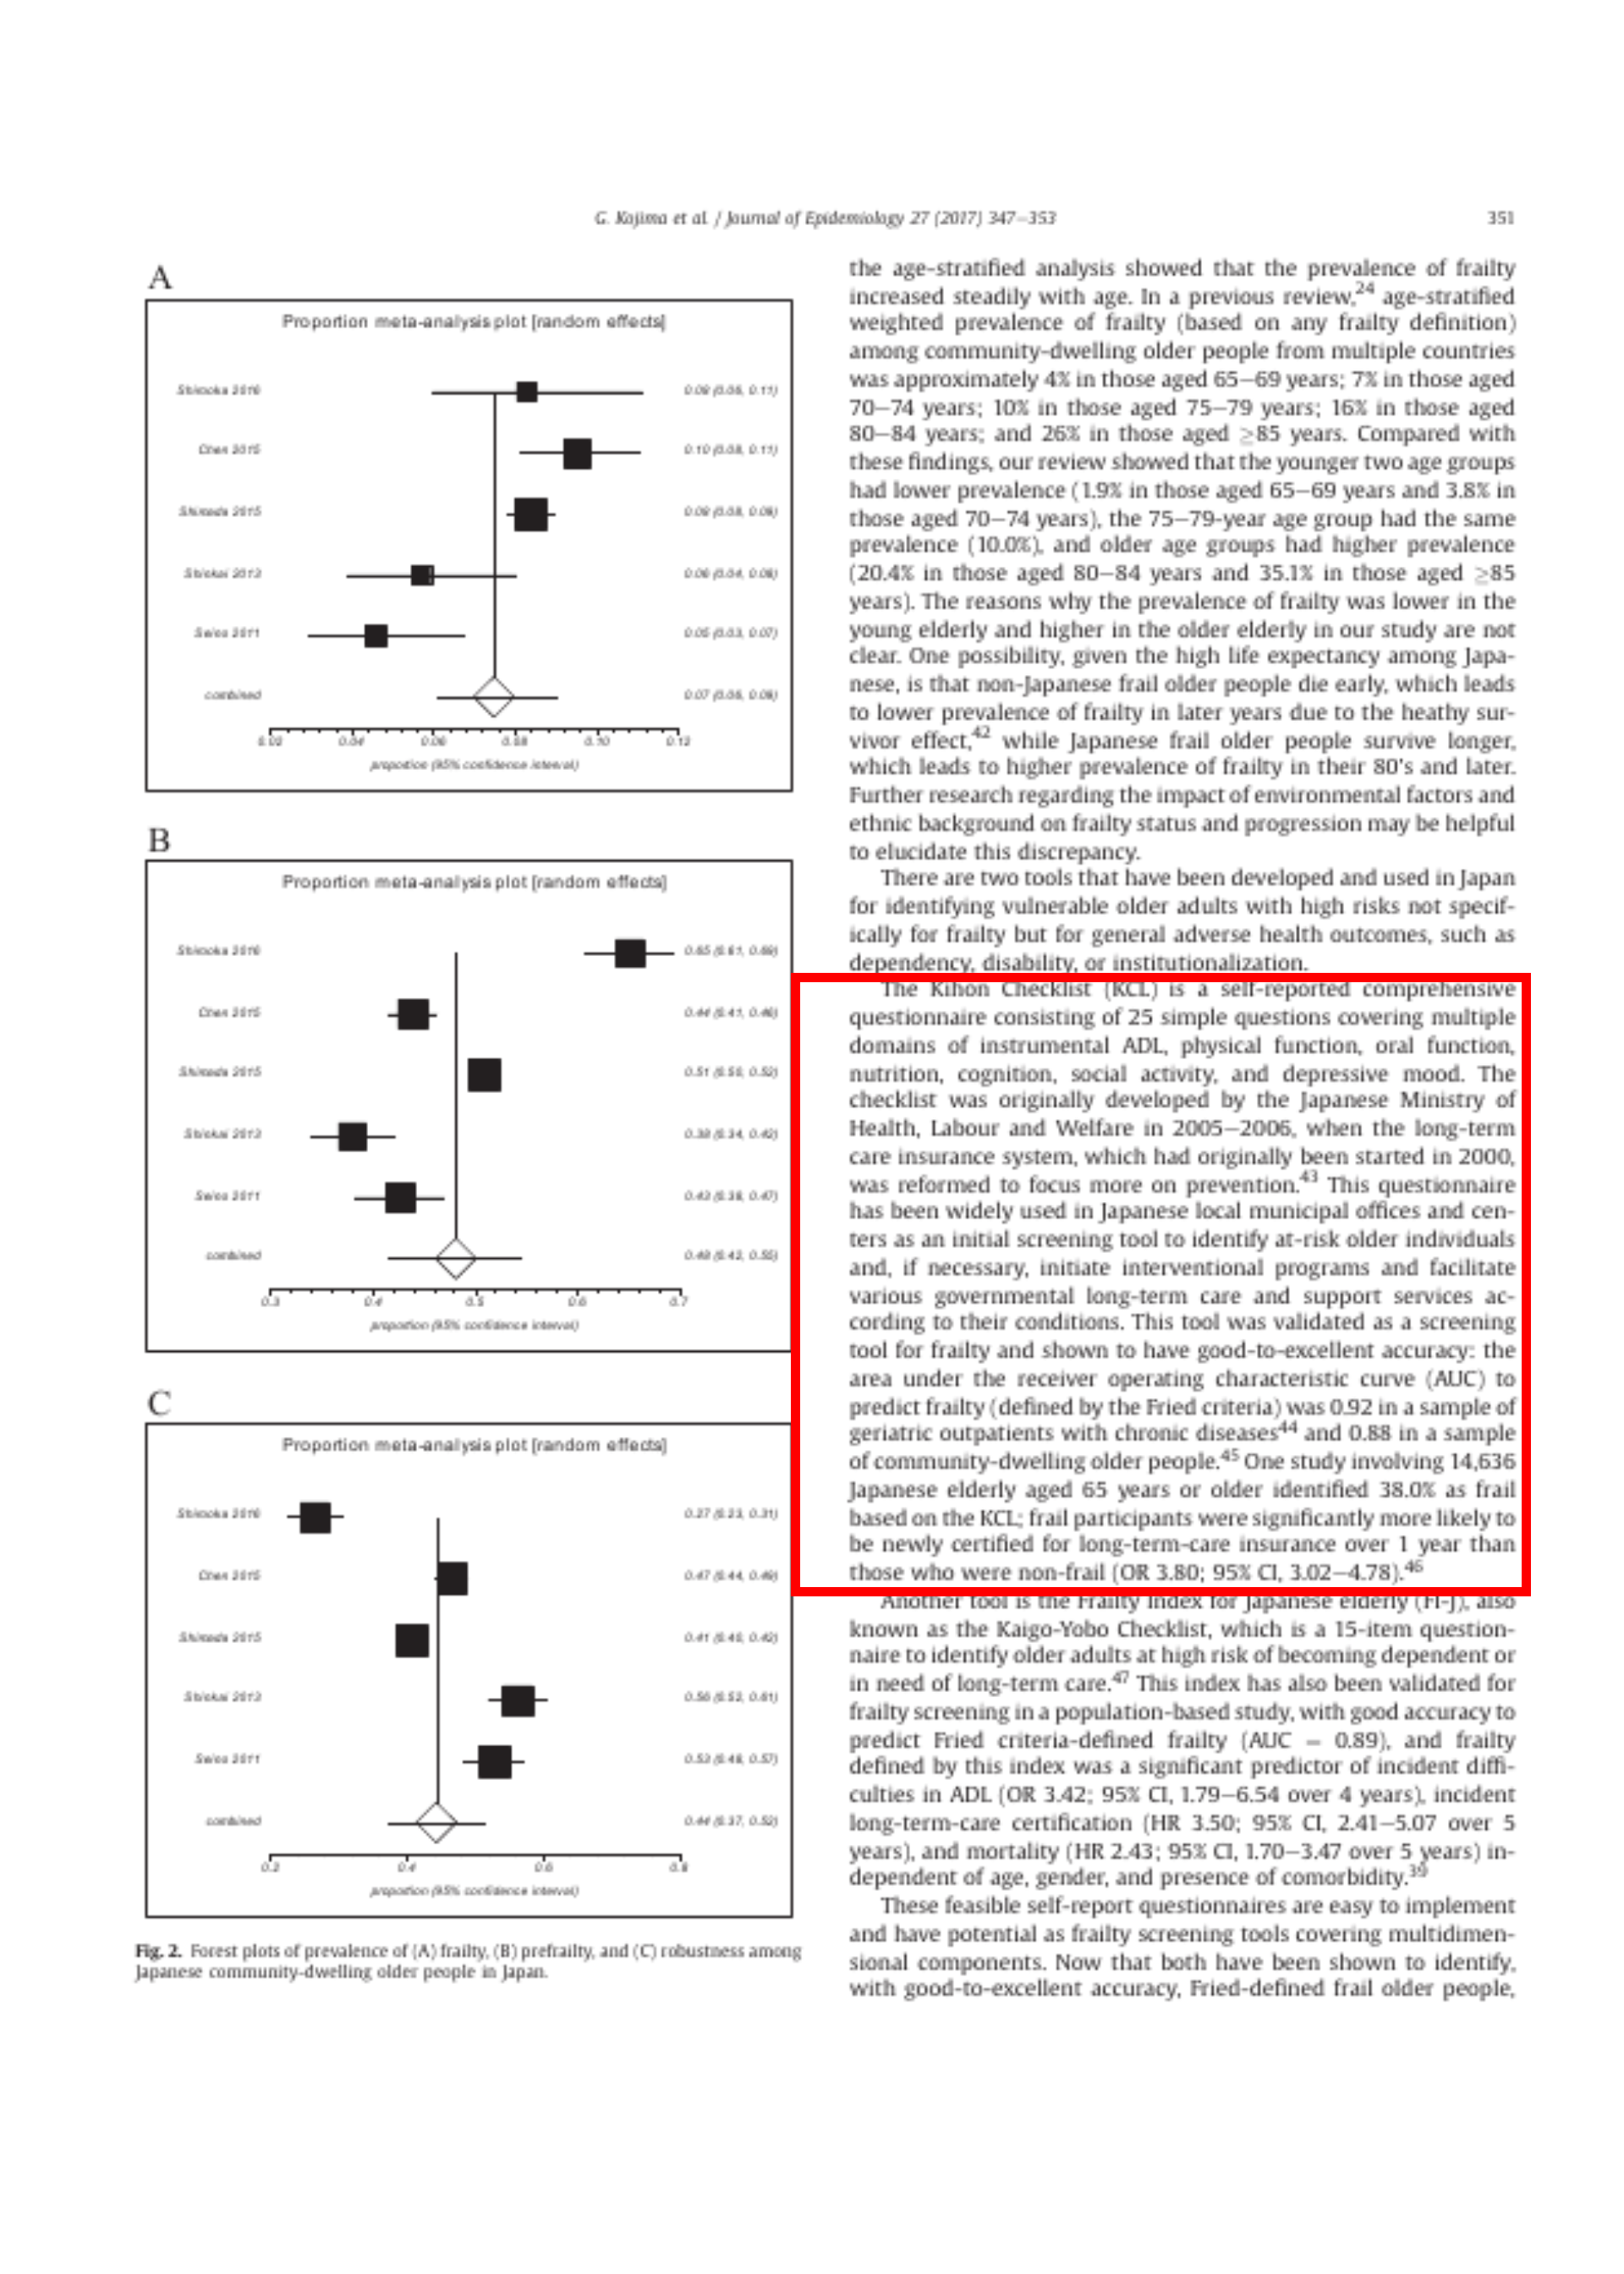
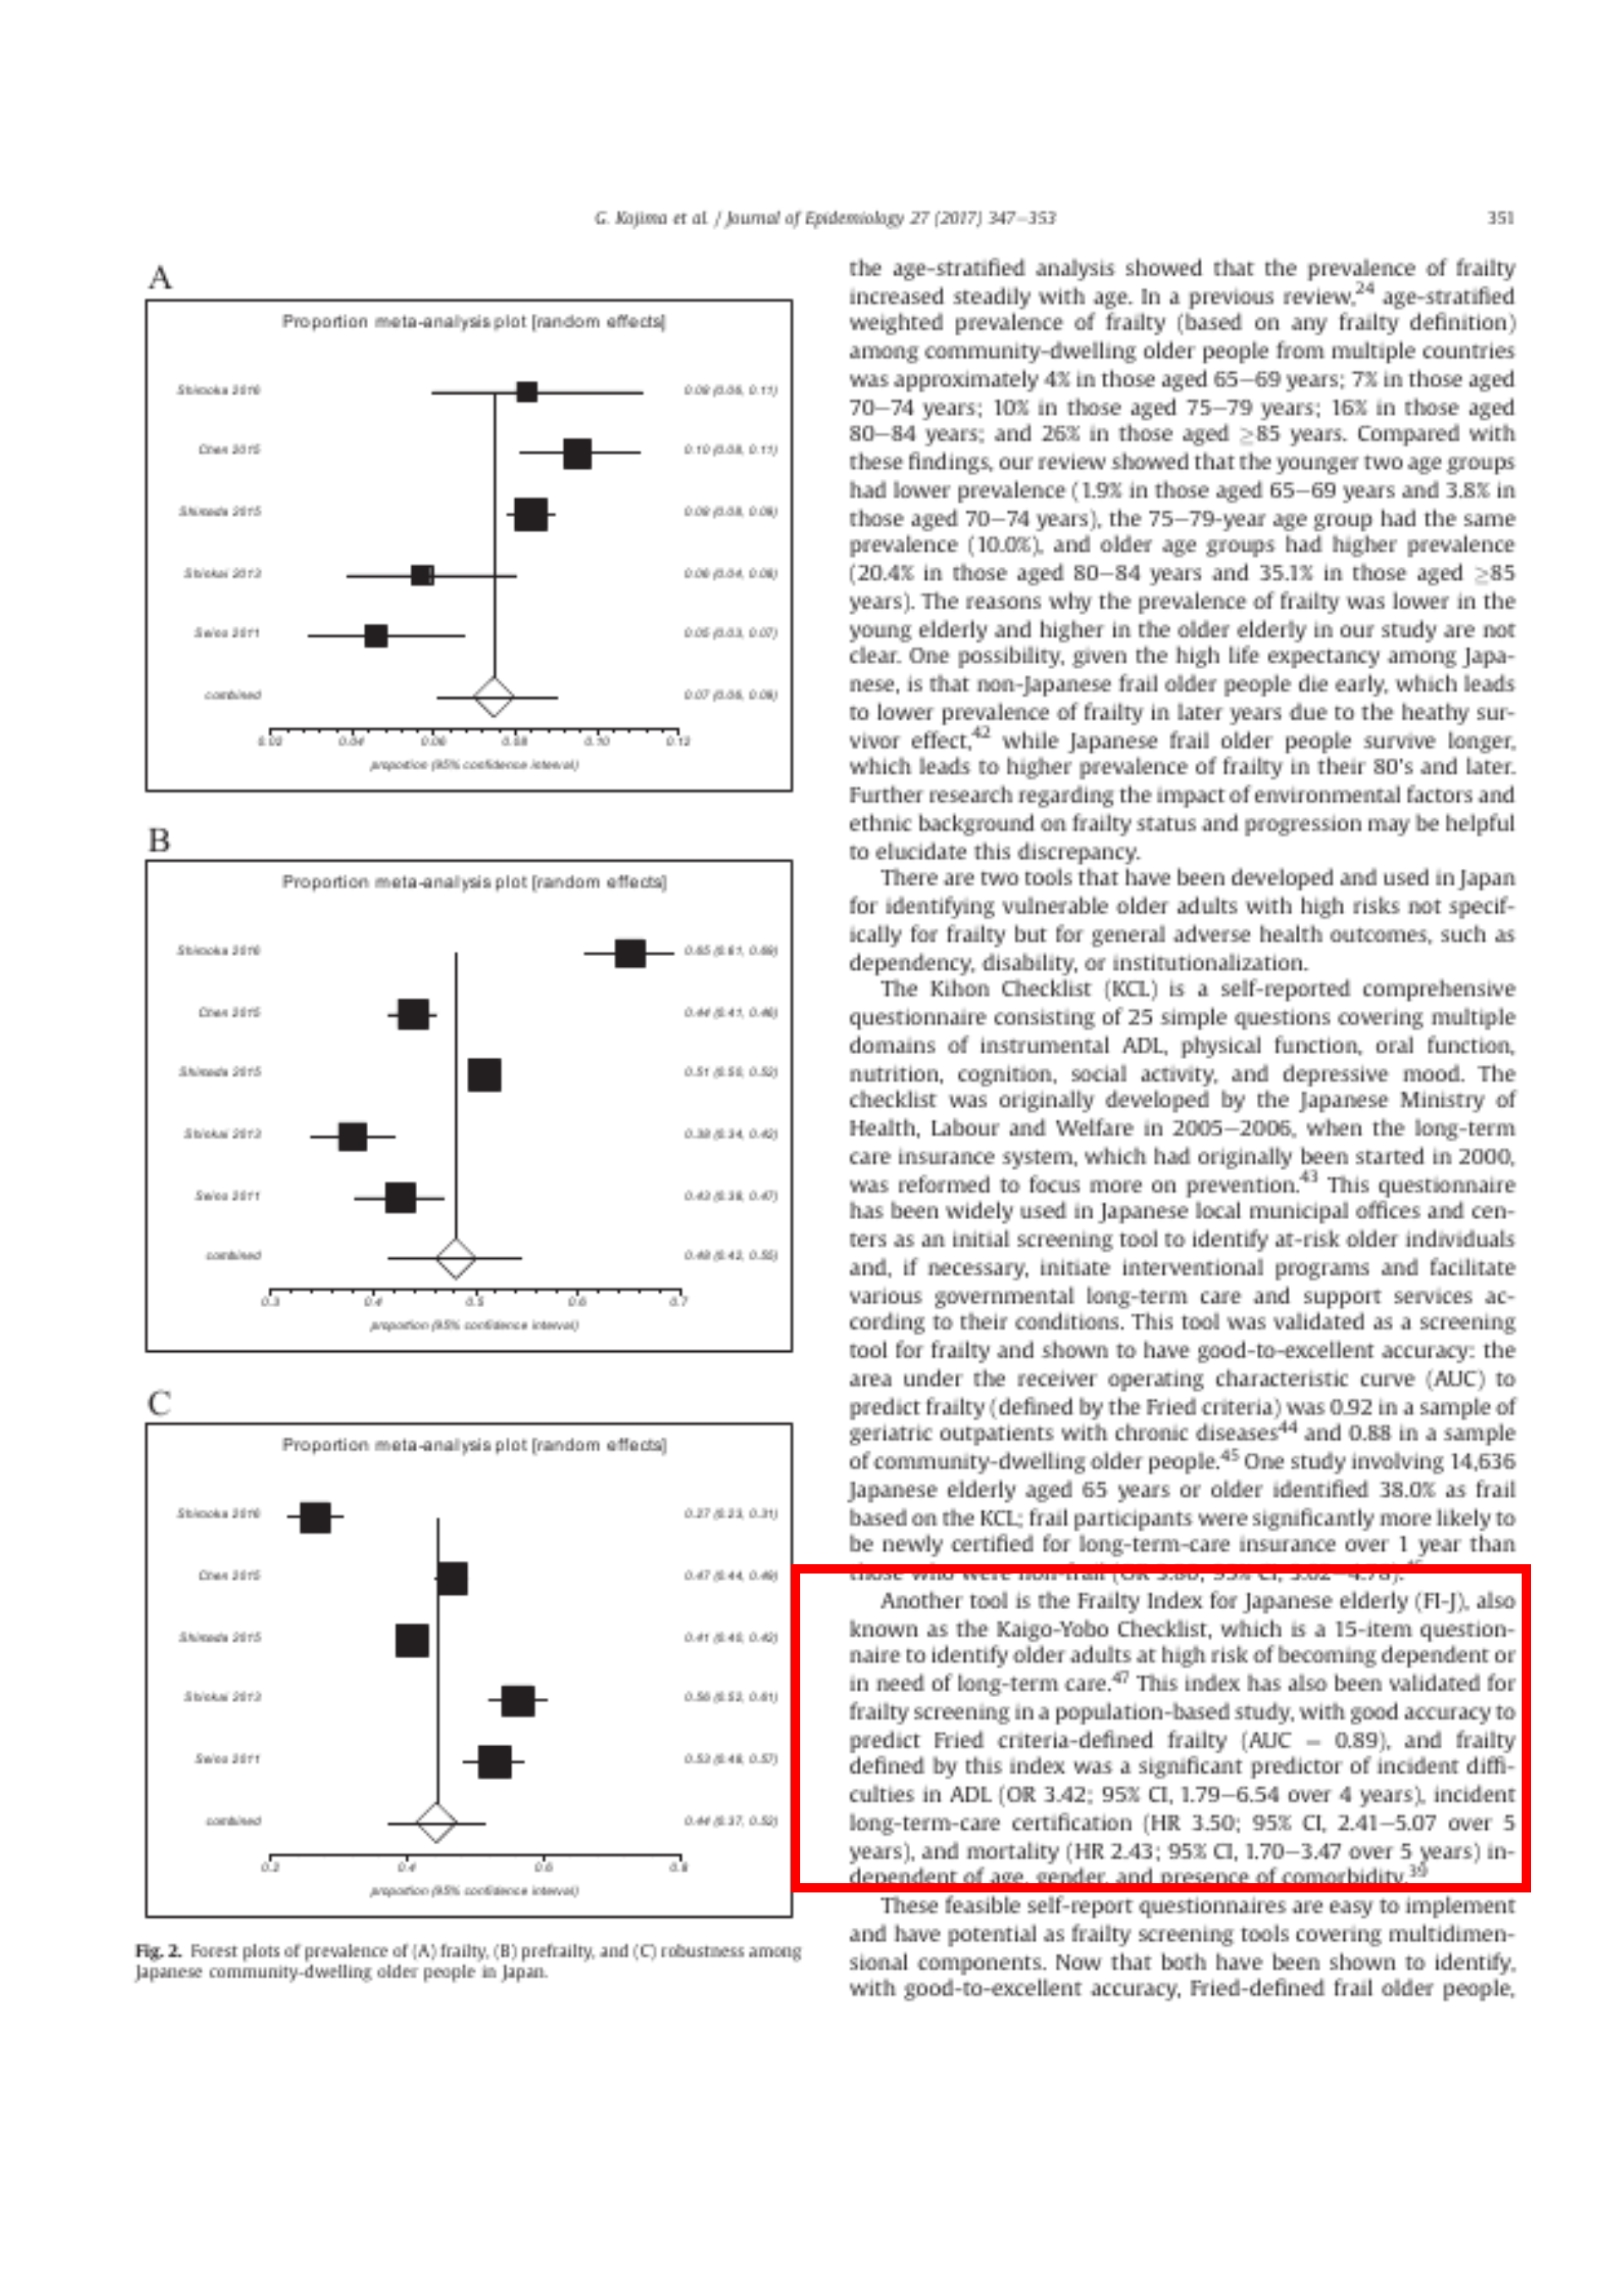
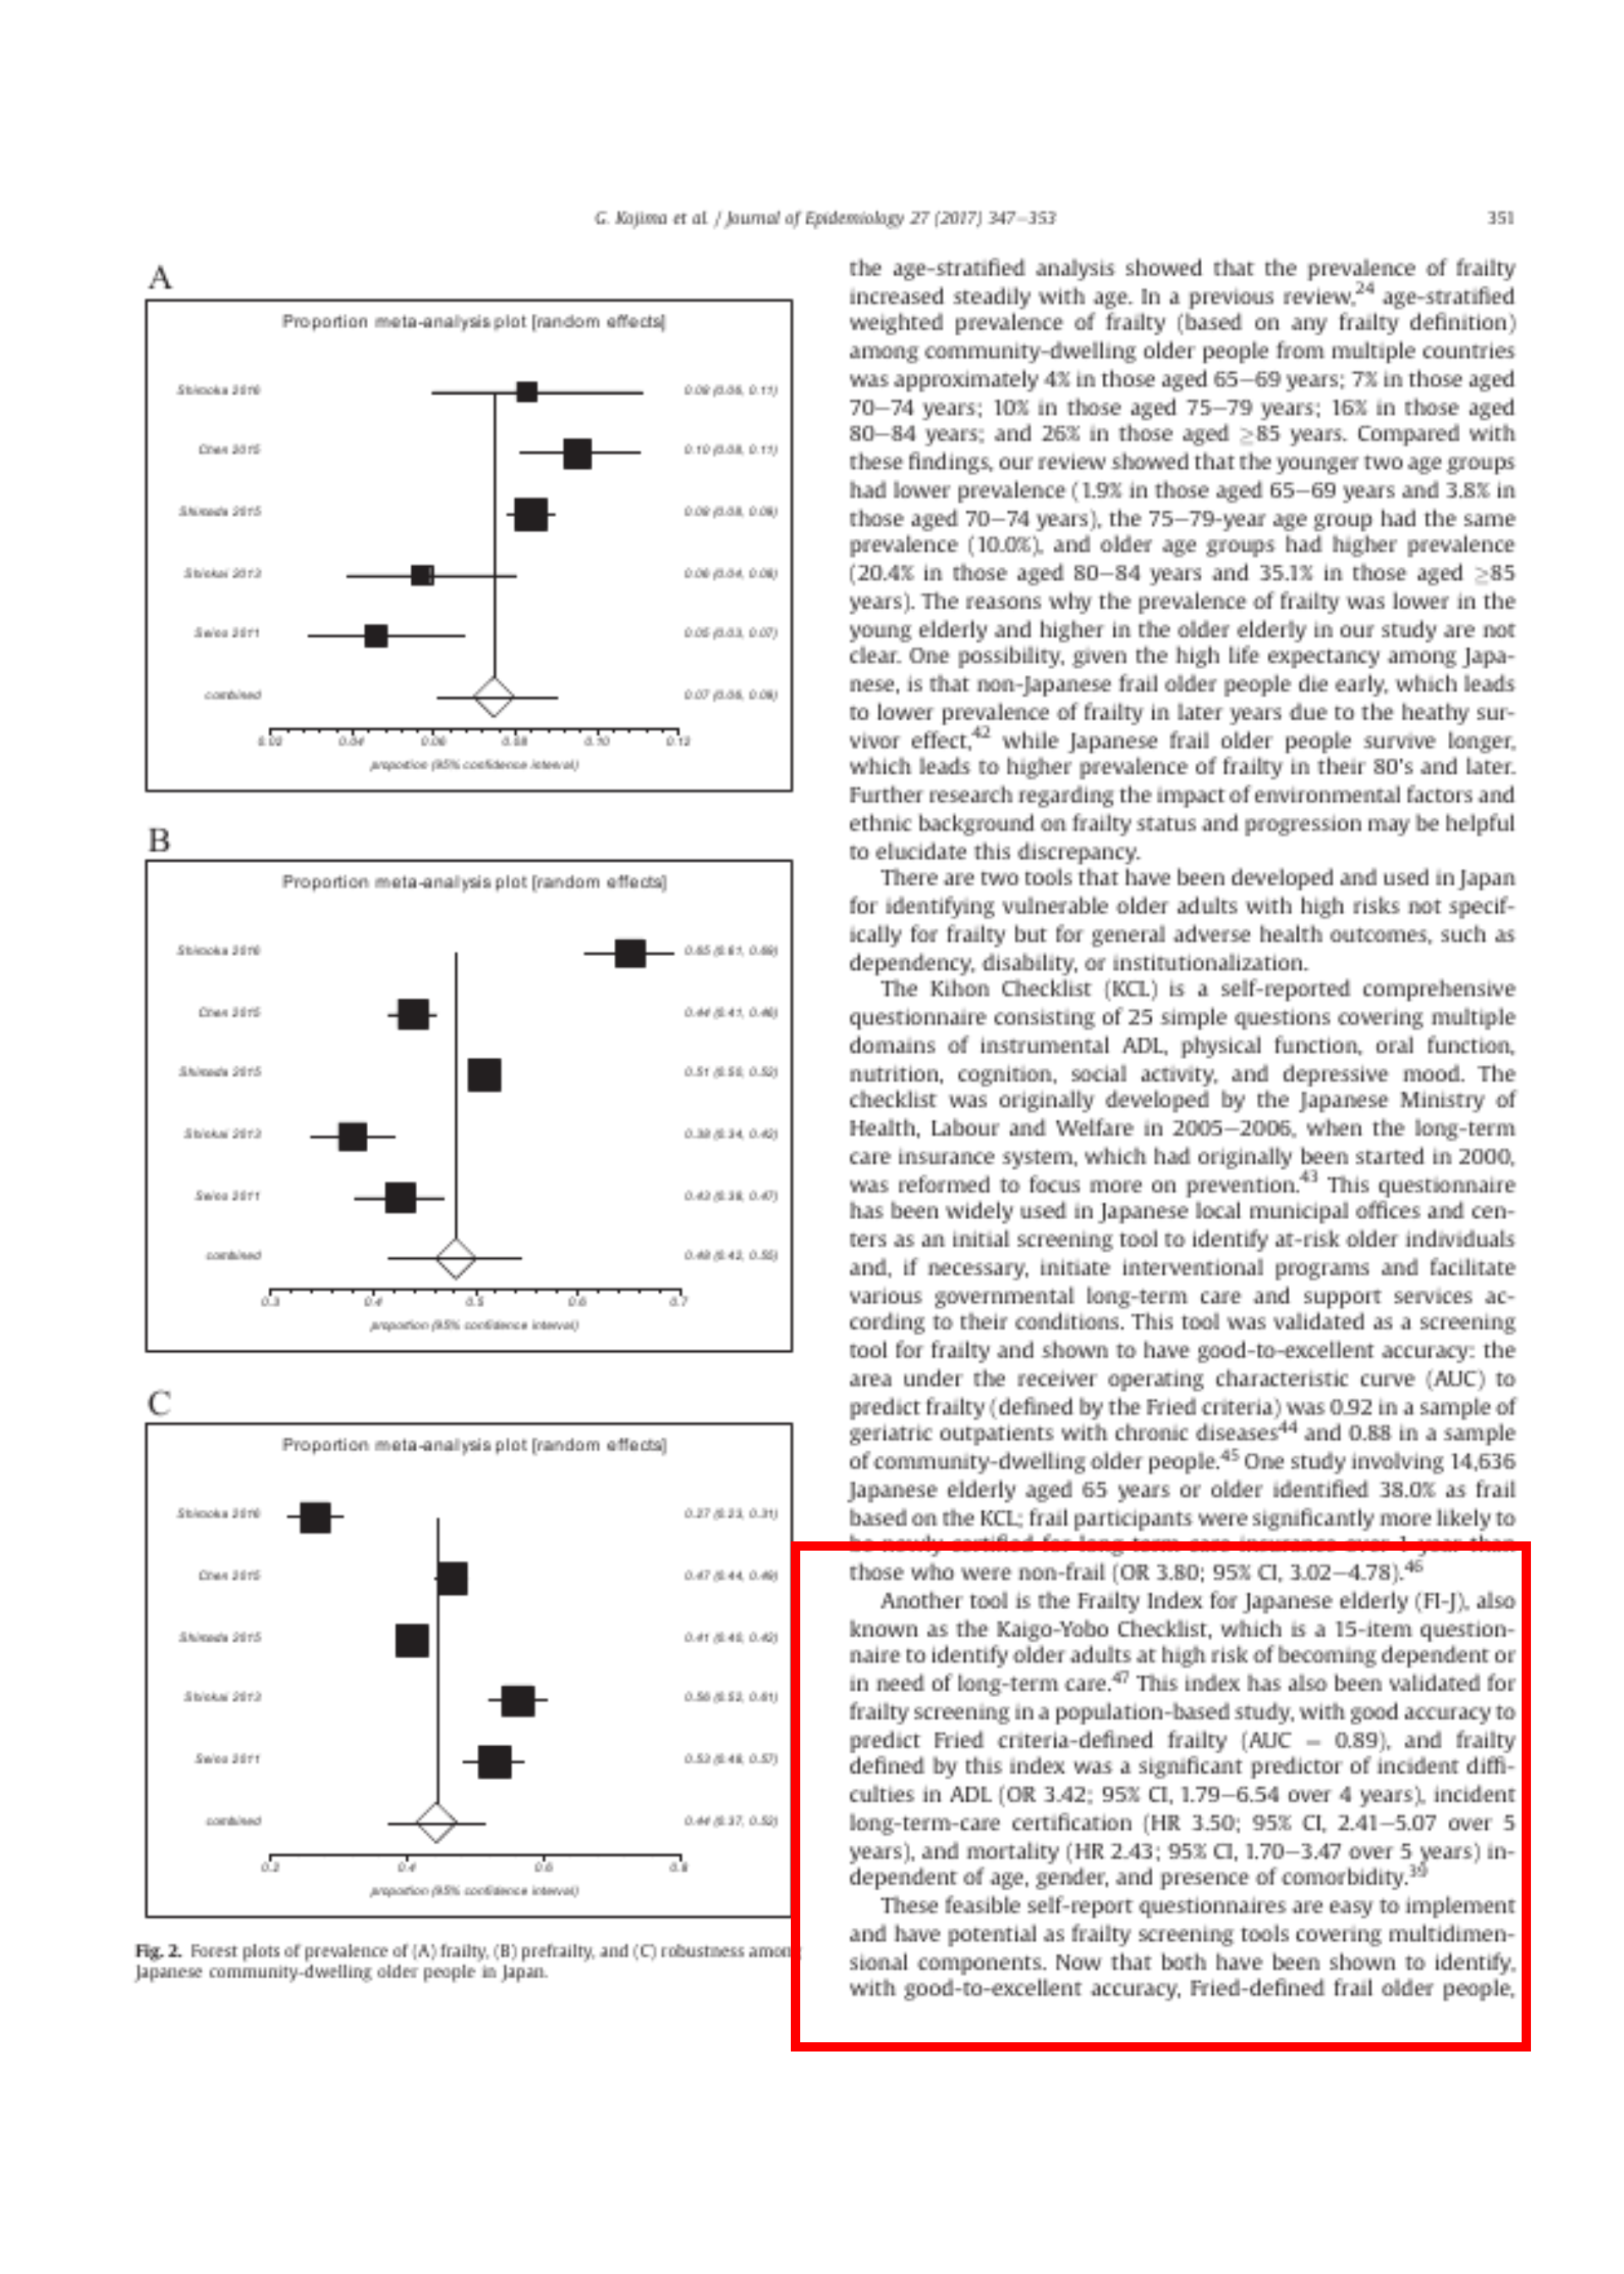
Prevalence of frailty
page 350
significant: (統計学的に)有意の
random-effects models: ランダム効果
pool: データを統合すること
publication bias: 出版バイアス
Data from five studies were available for
Quiz ランダム効果モデルを用いない場合、どういったモデルを用いるか?
- 固定効果モデル
- プラモデル
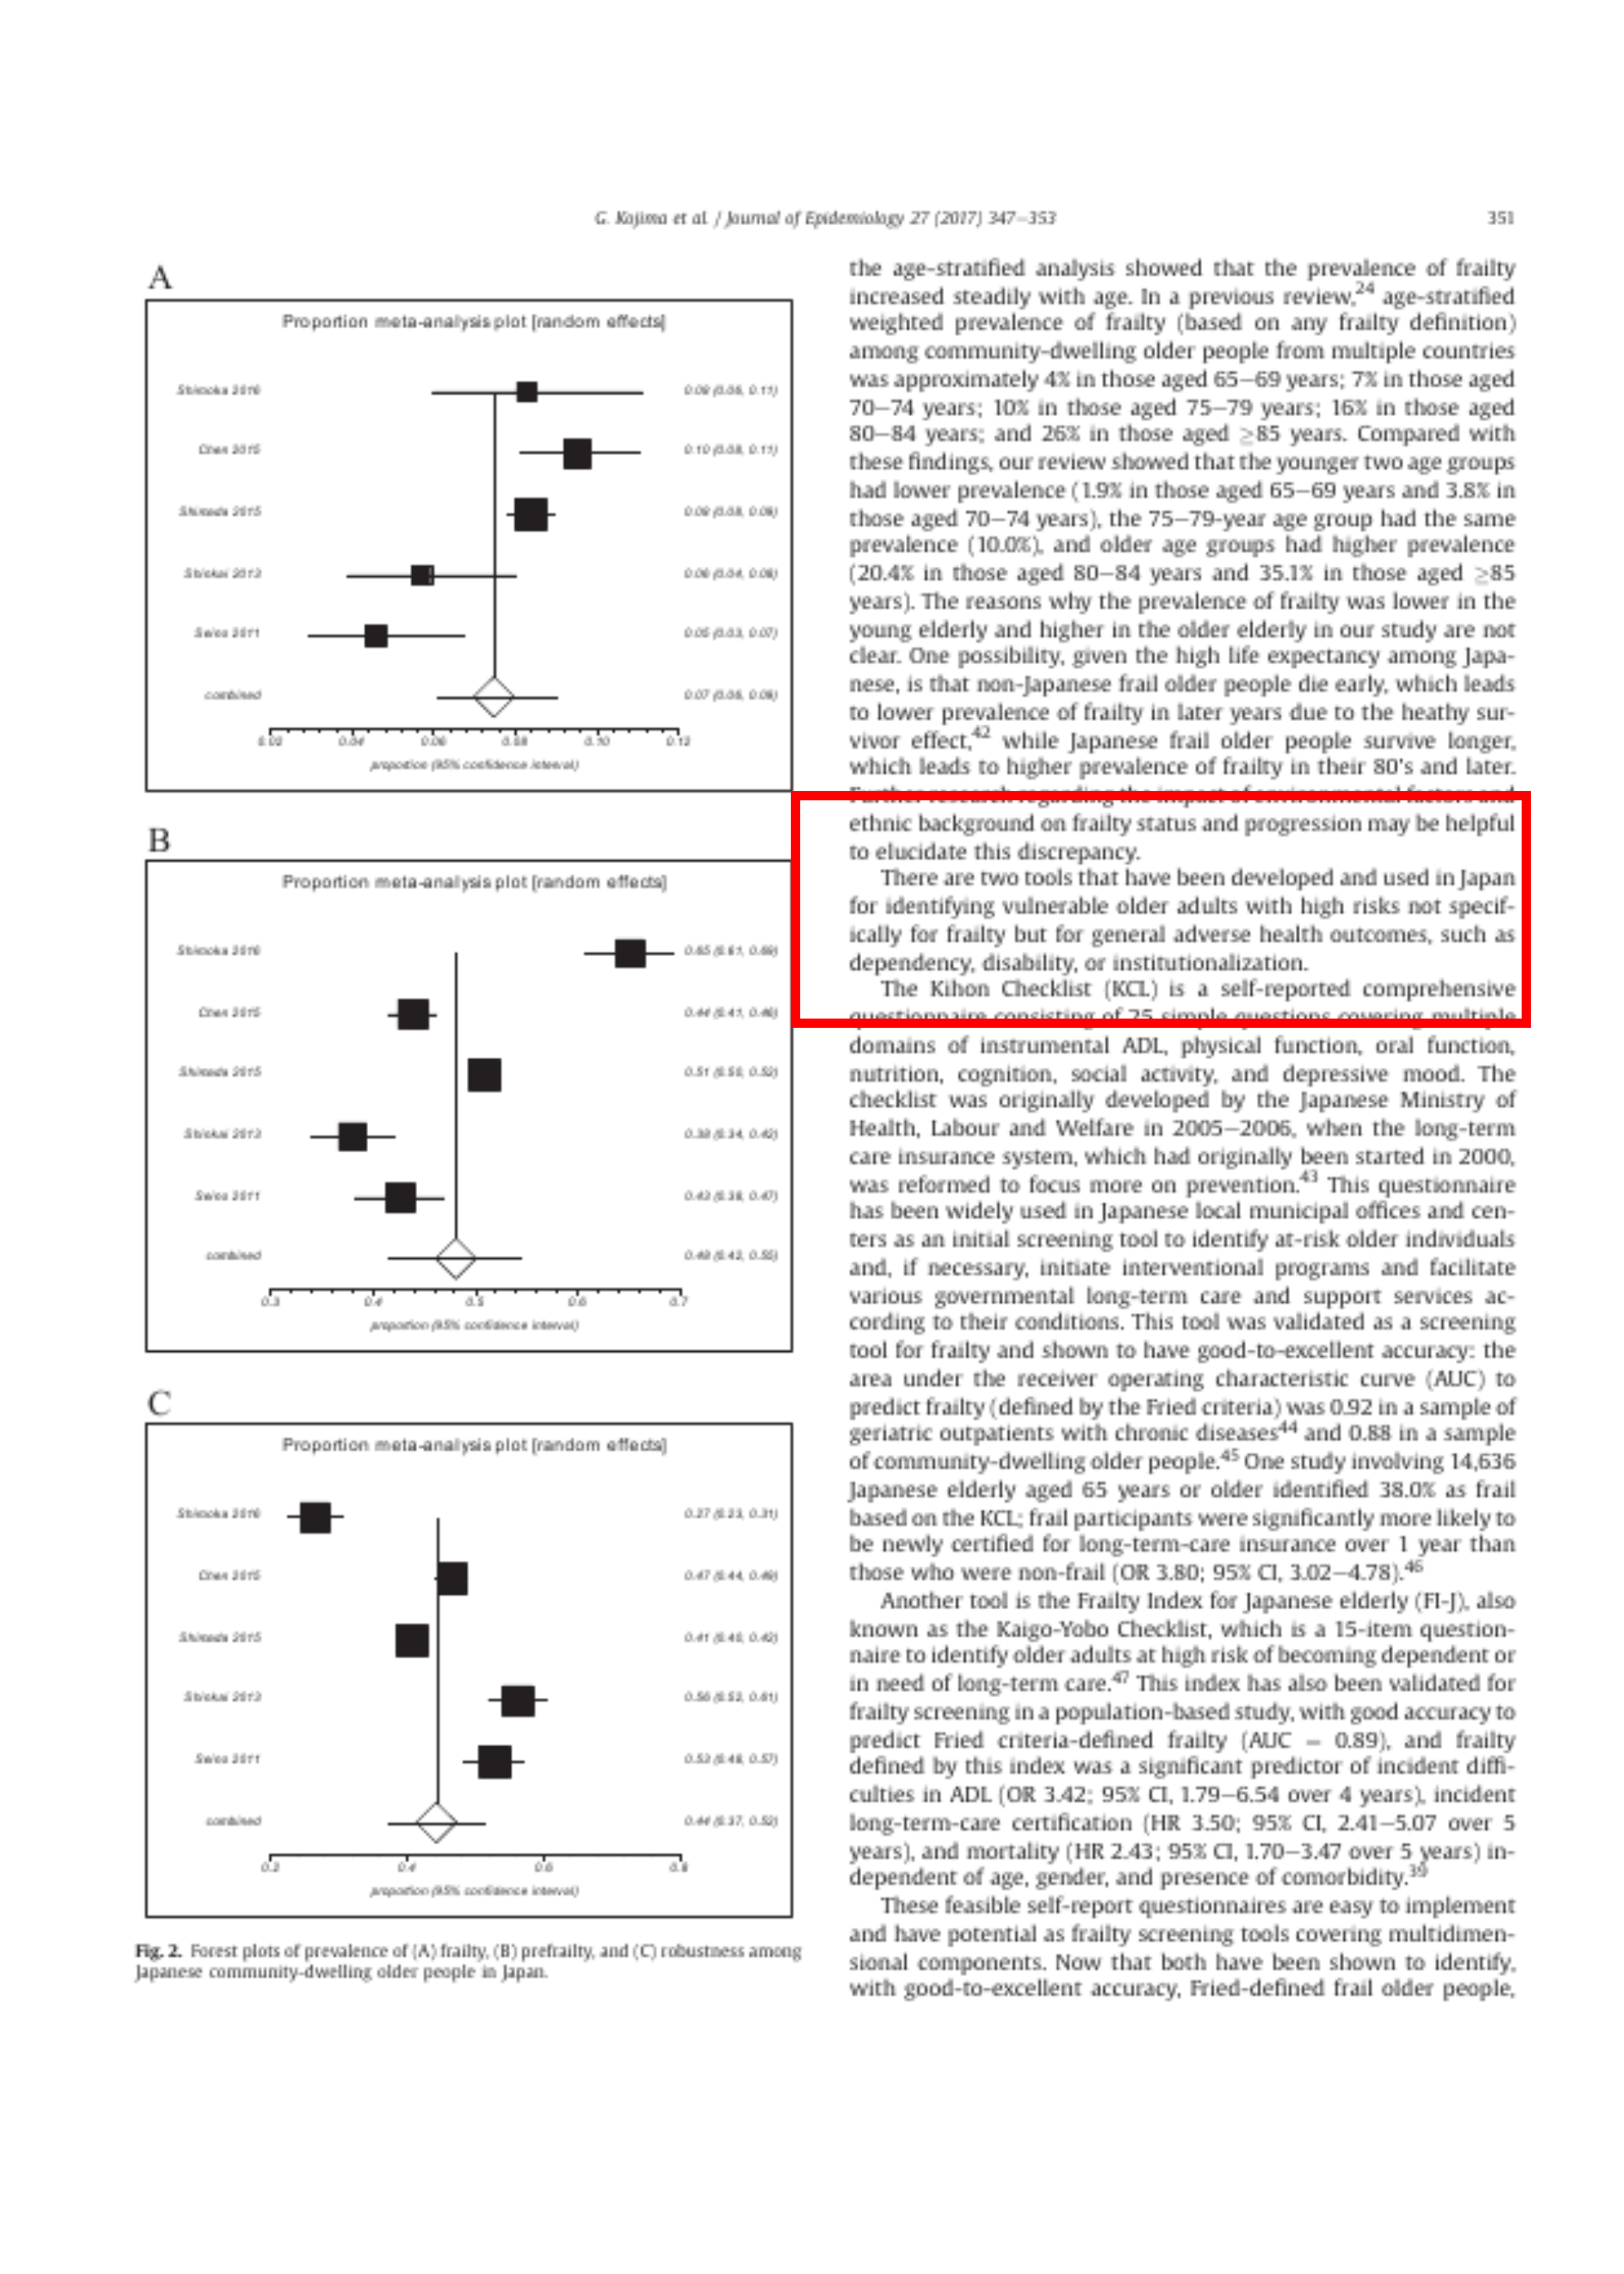
フレイル状態の有病率に関するメタ分析には、5件の研究データが利用可能であった。個々の研究における
- フレイル: 4.6%〜9.5%
- プレフレイル: 38.0%〜65.2%
- 頑健: 26.5%〜56.3%
- 有意な異質性(I2 = 79.2%-97.1%, すべて p < 0.001)
- ランダム効果モデルを使用
- 出版バイアスの証拠はない
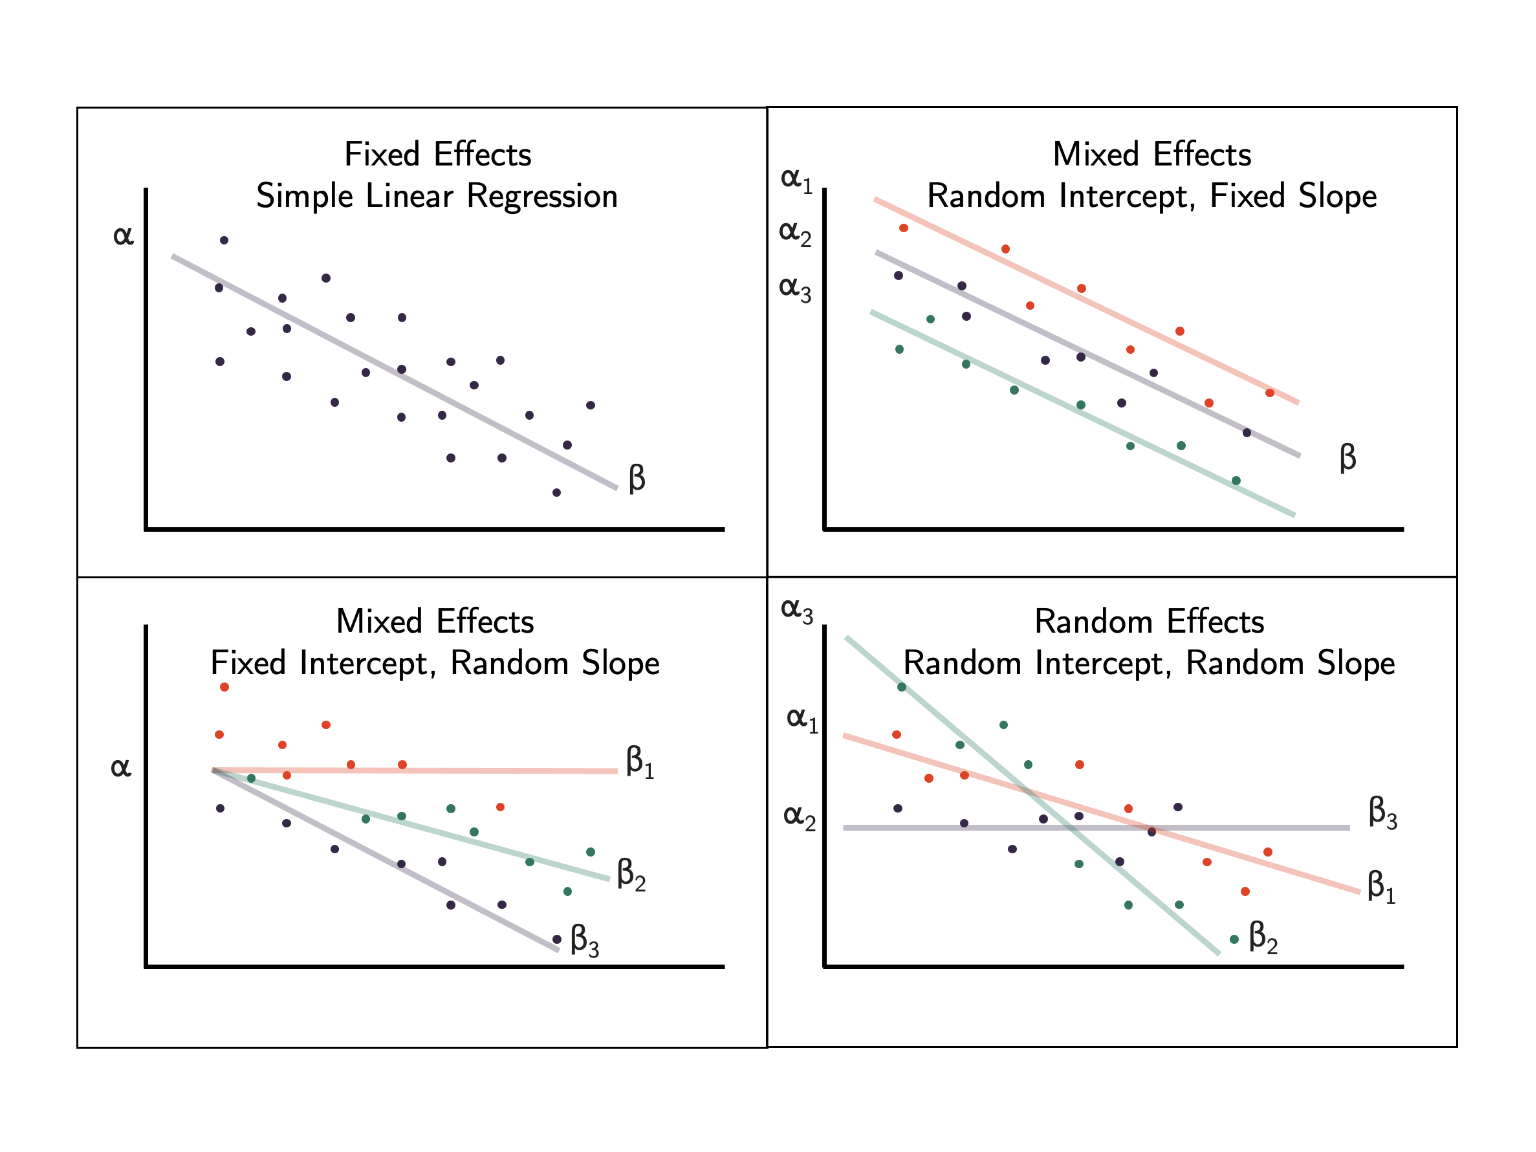
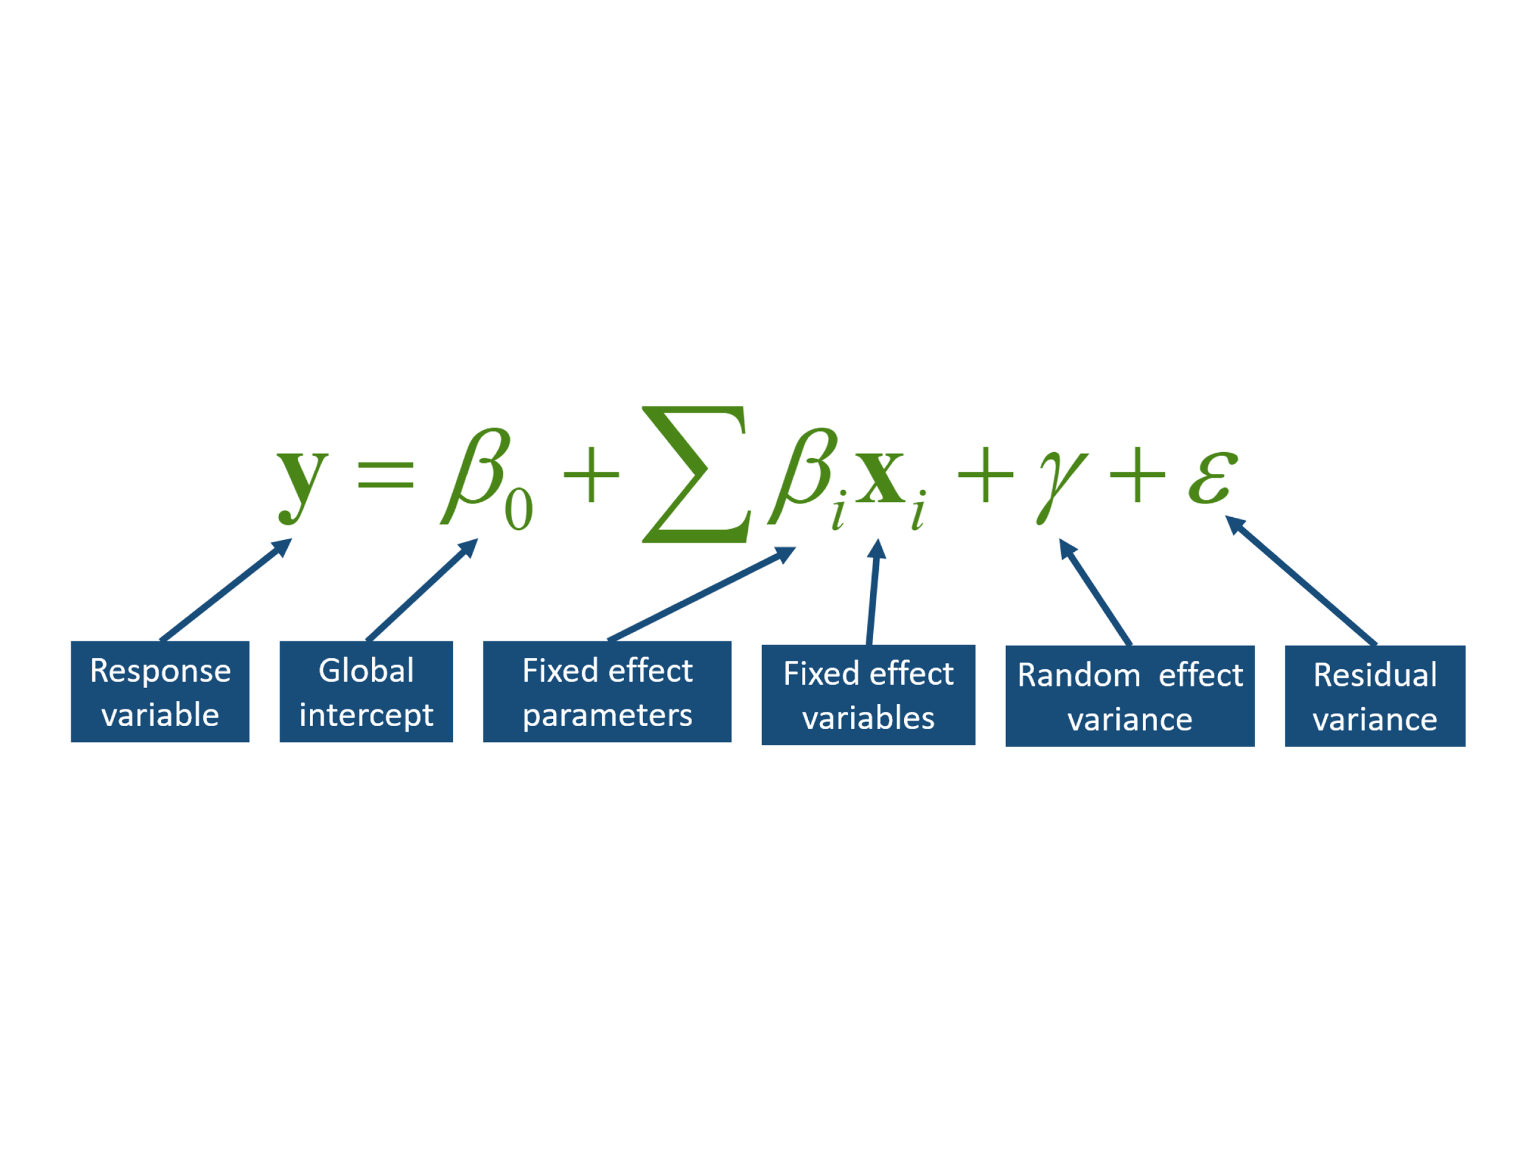
線形混合効果モデルは、応答変数 (y) が
- グローバル切片
- 固定効果による変化
- ランダム効果カテゴリのメンバーシップによる偏差
- 固定効果やランダム効果で説明できない残差変動
の加法関数であると記述することが可能
DOI: 10.7717/peerj.9522/fig-1
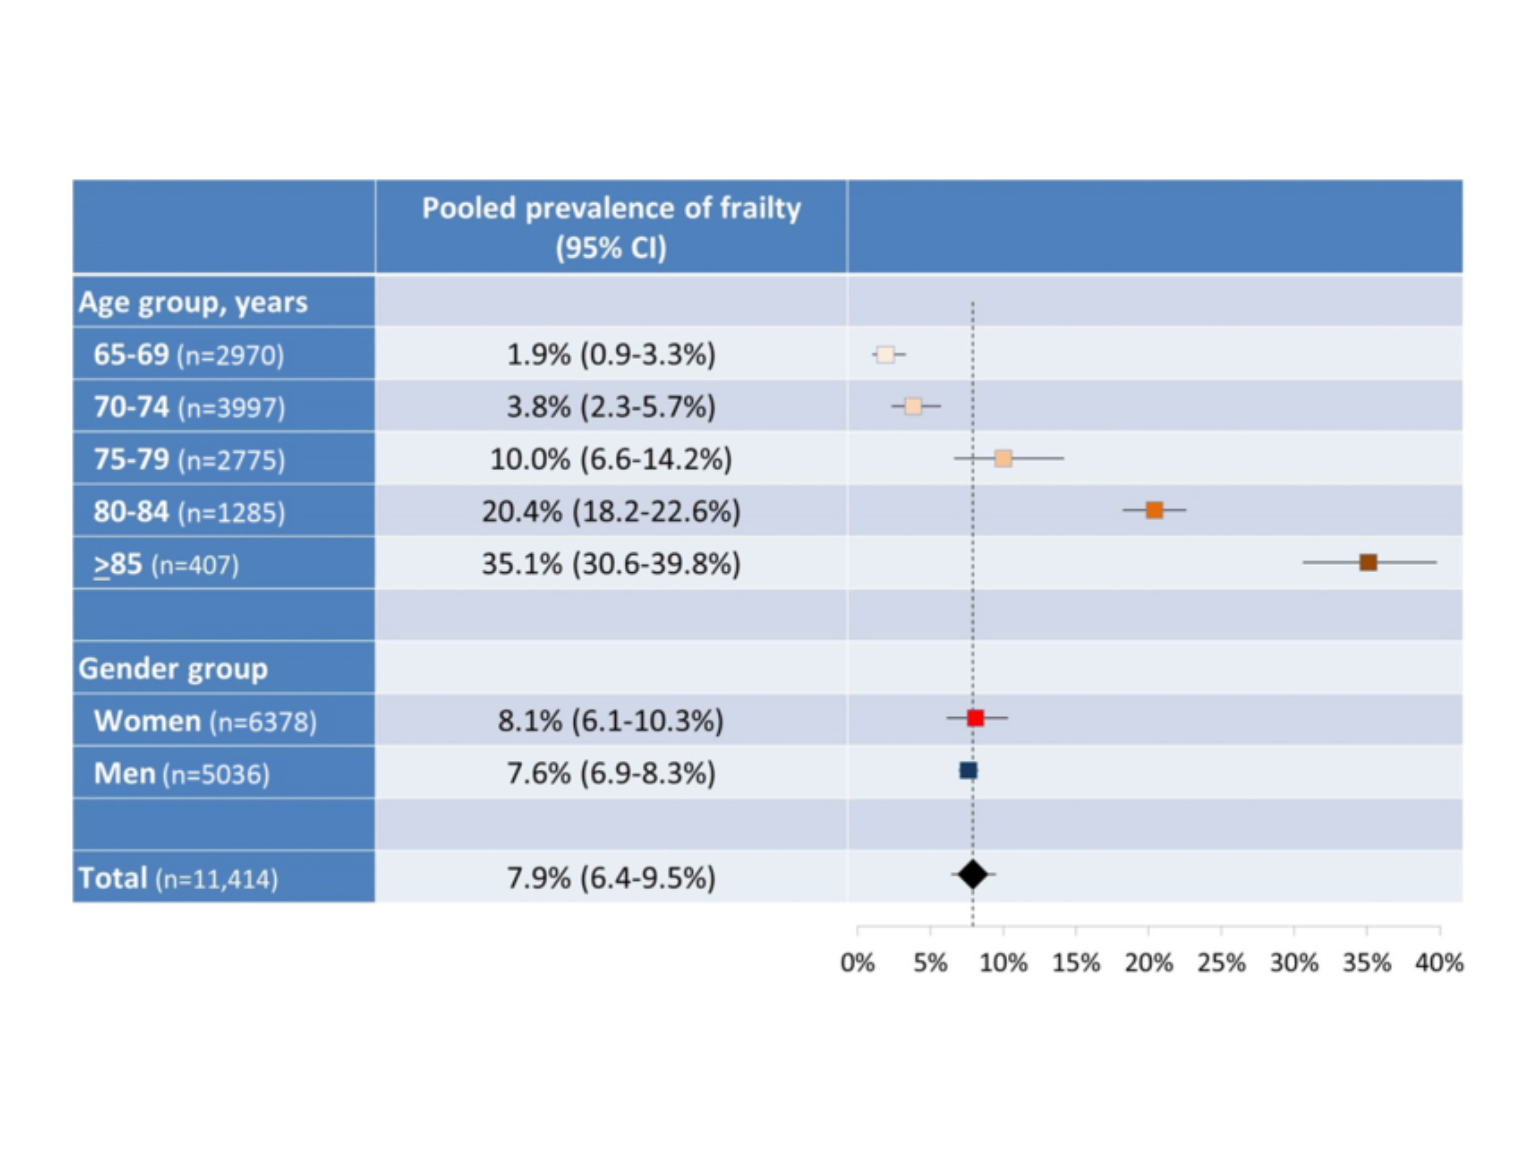
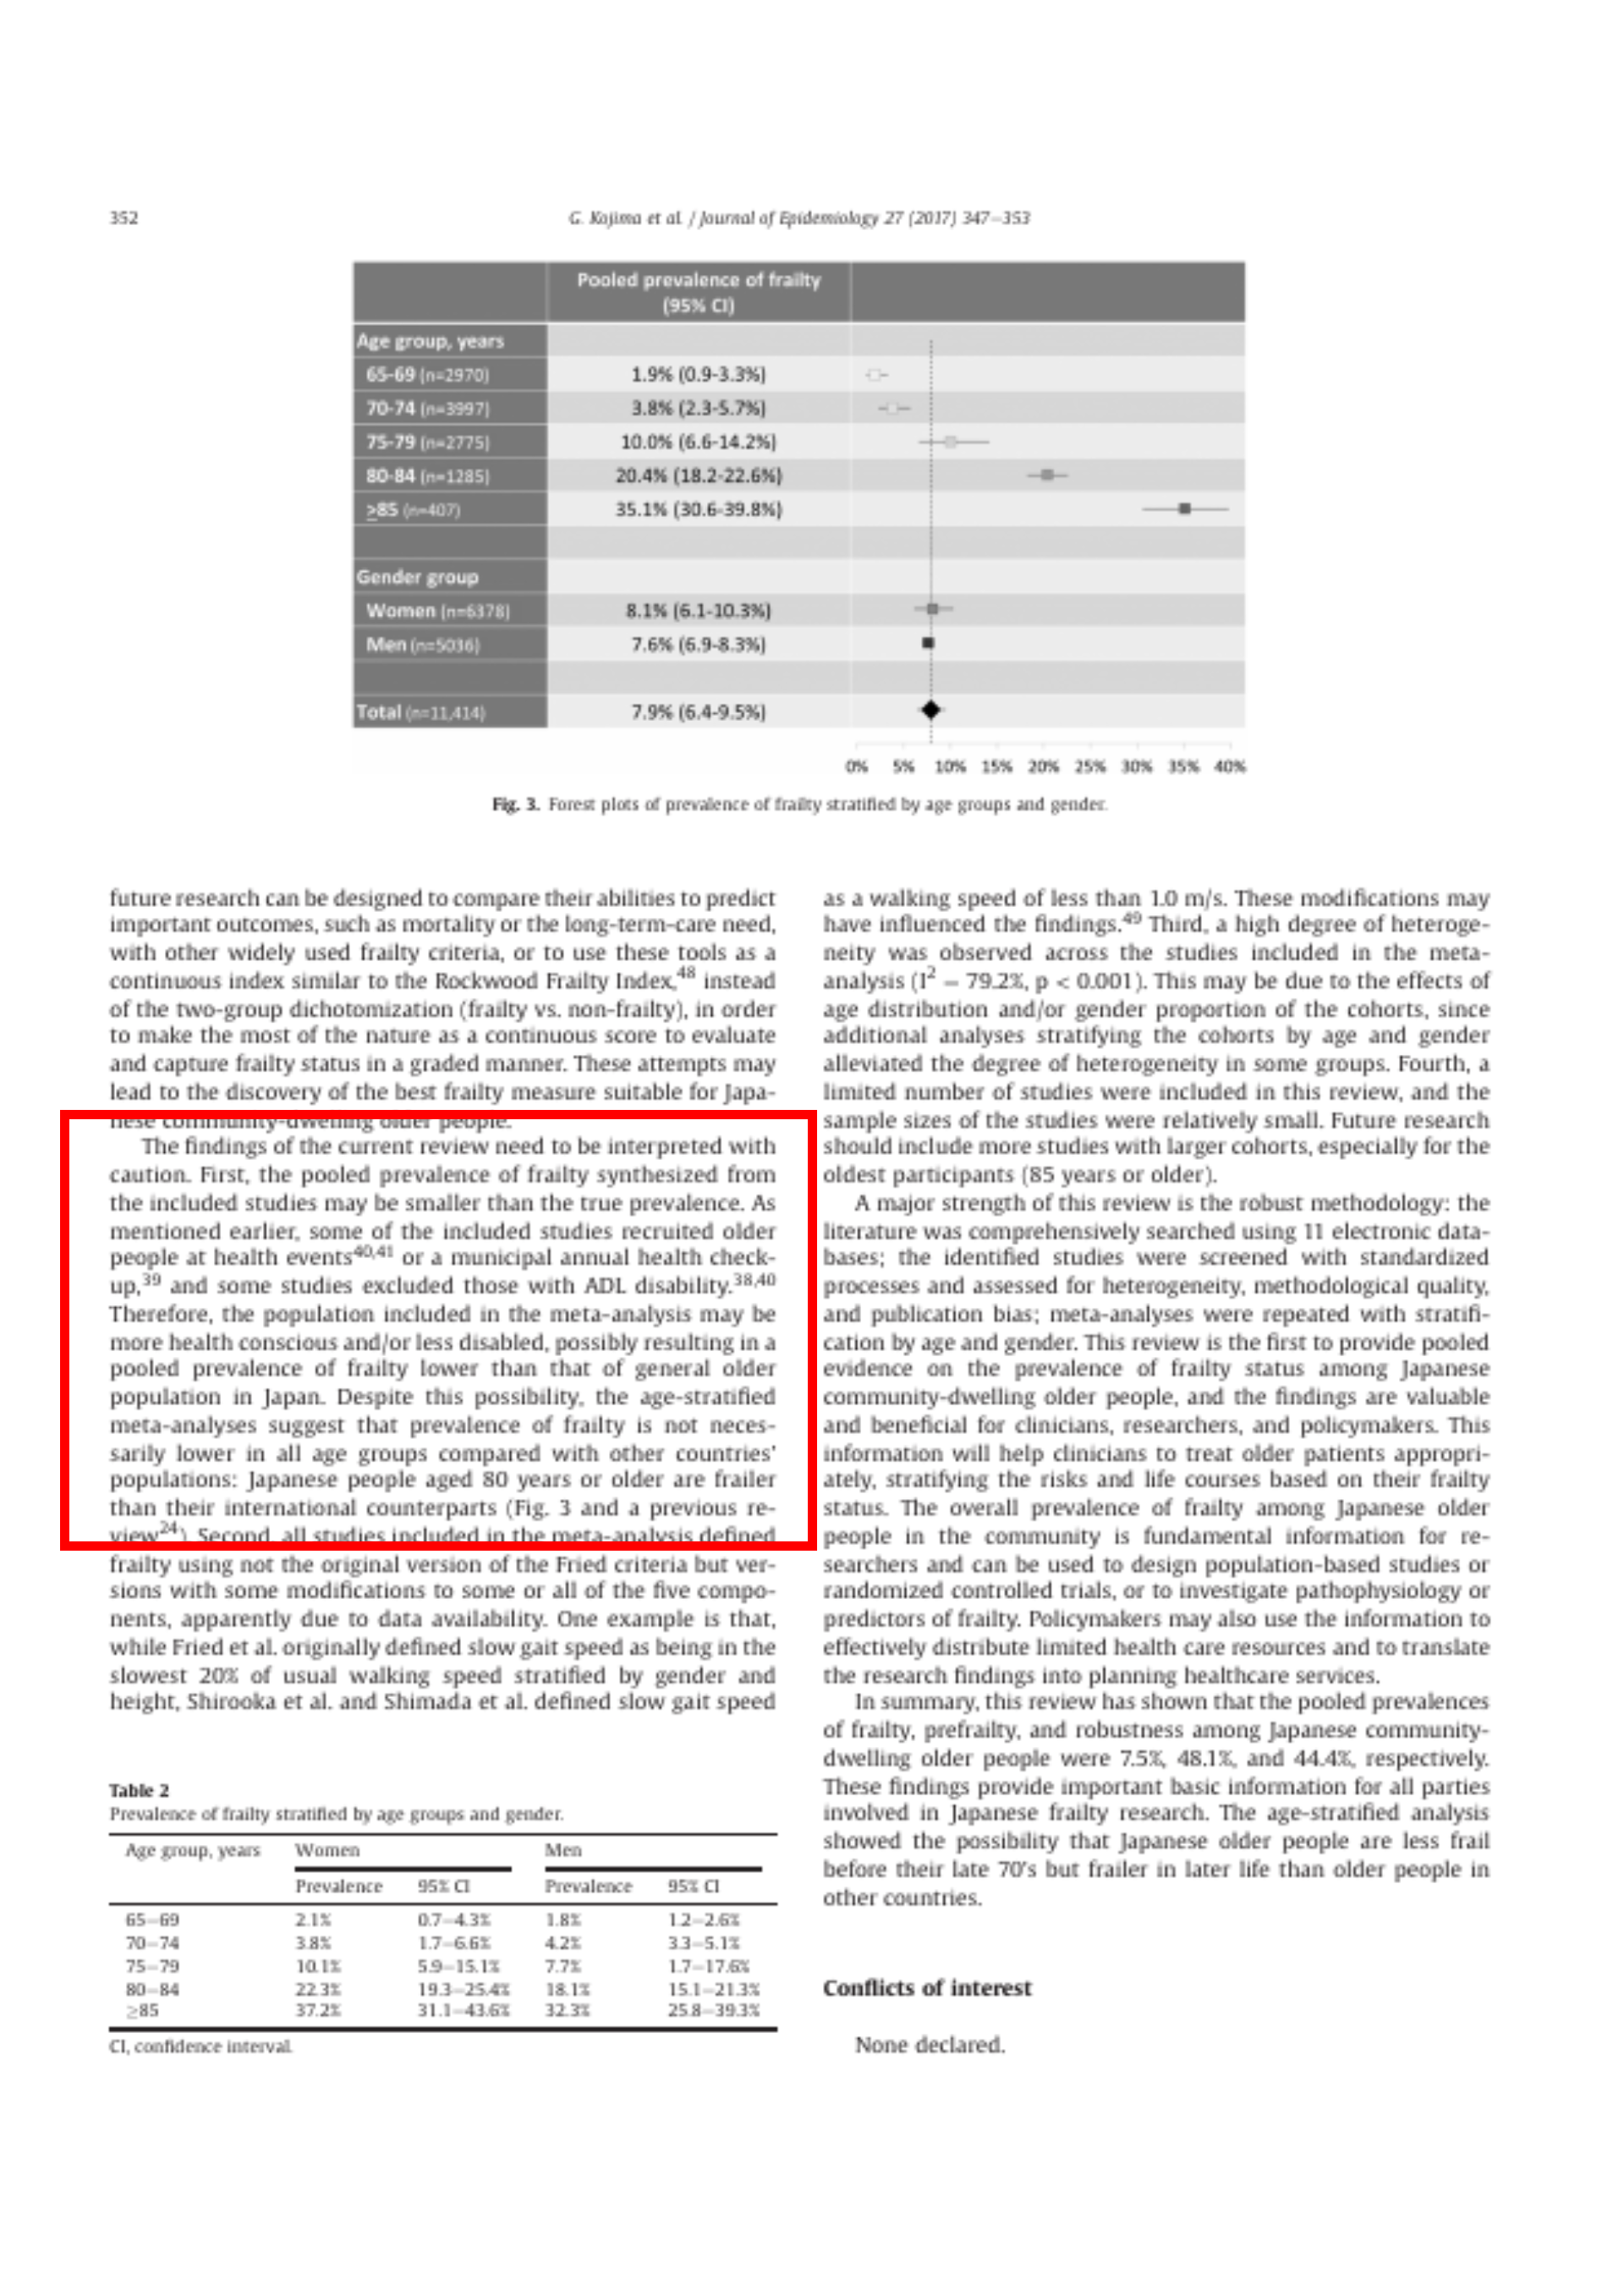
Stratified analysis

page 350
Additional data were obtained upon request from the authors of four studies37, 38, 40, 41 and were used for
Quiz 層別化する際の問題点は何か?
- サンプルサイズが小さくなるので、サンプルサイズを大きくする必要がある
- 層別化しない解析と結果が異なる
- 年齢、性別、両方で層別化
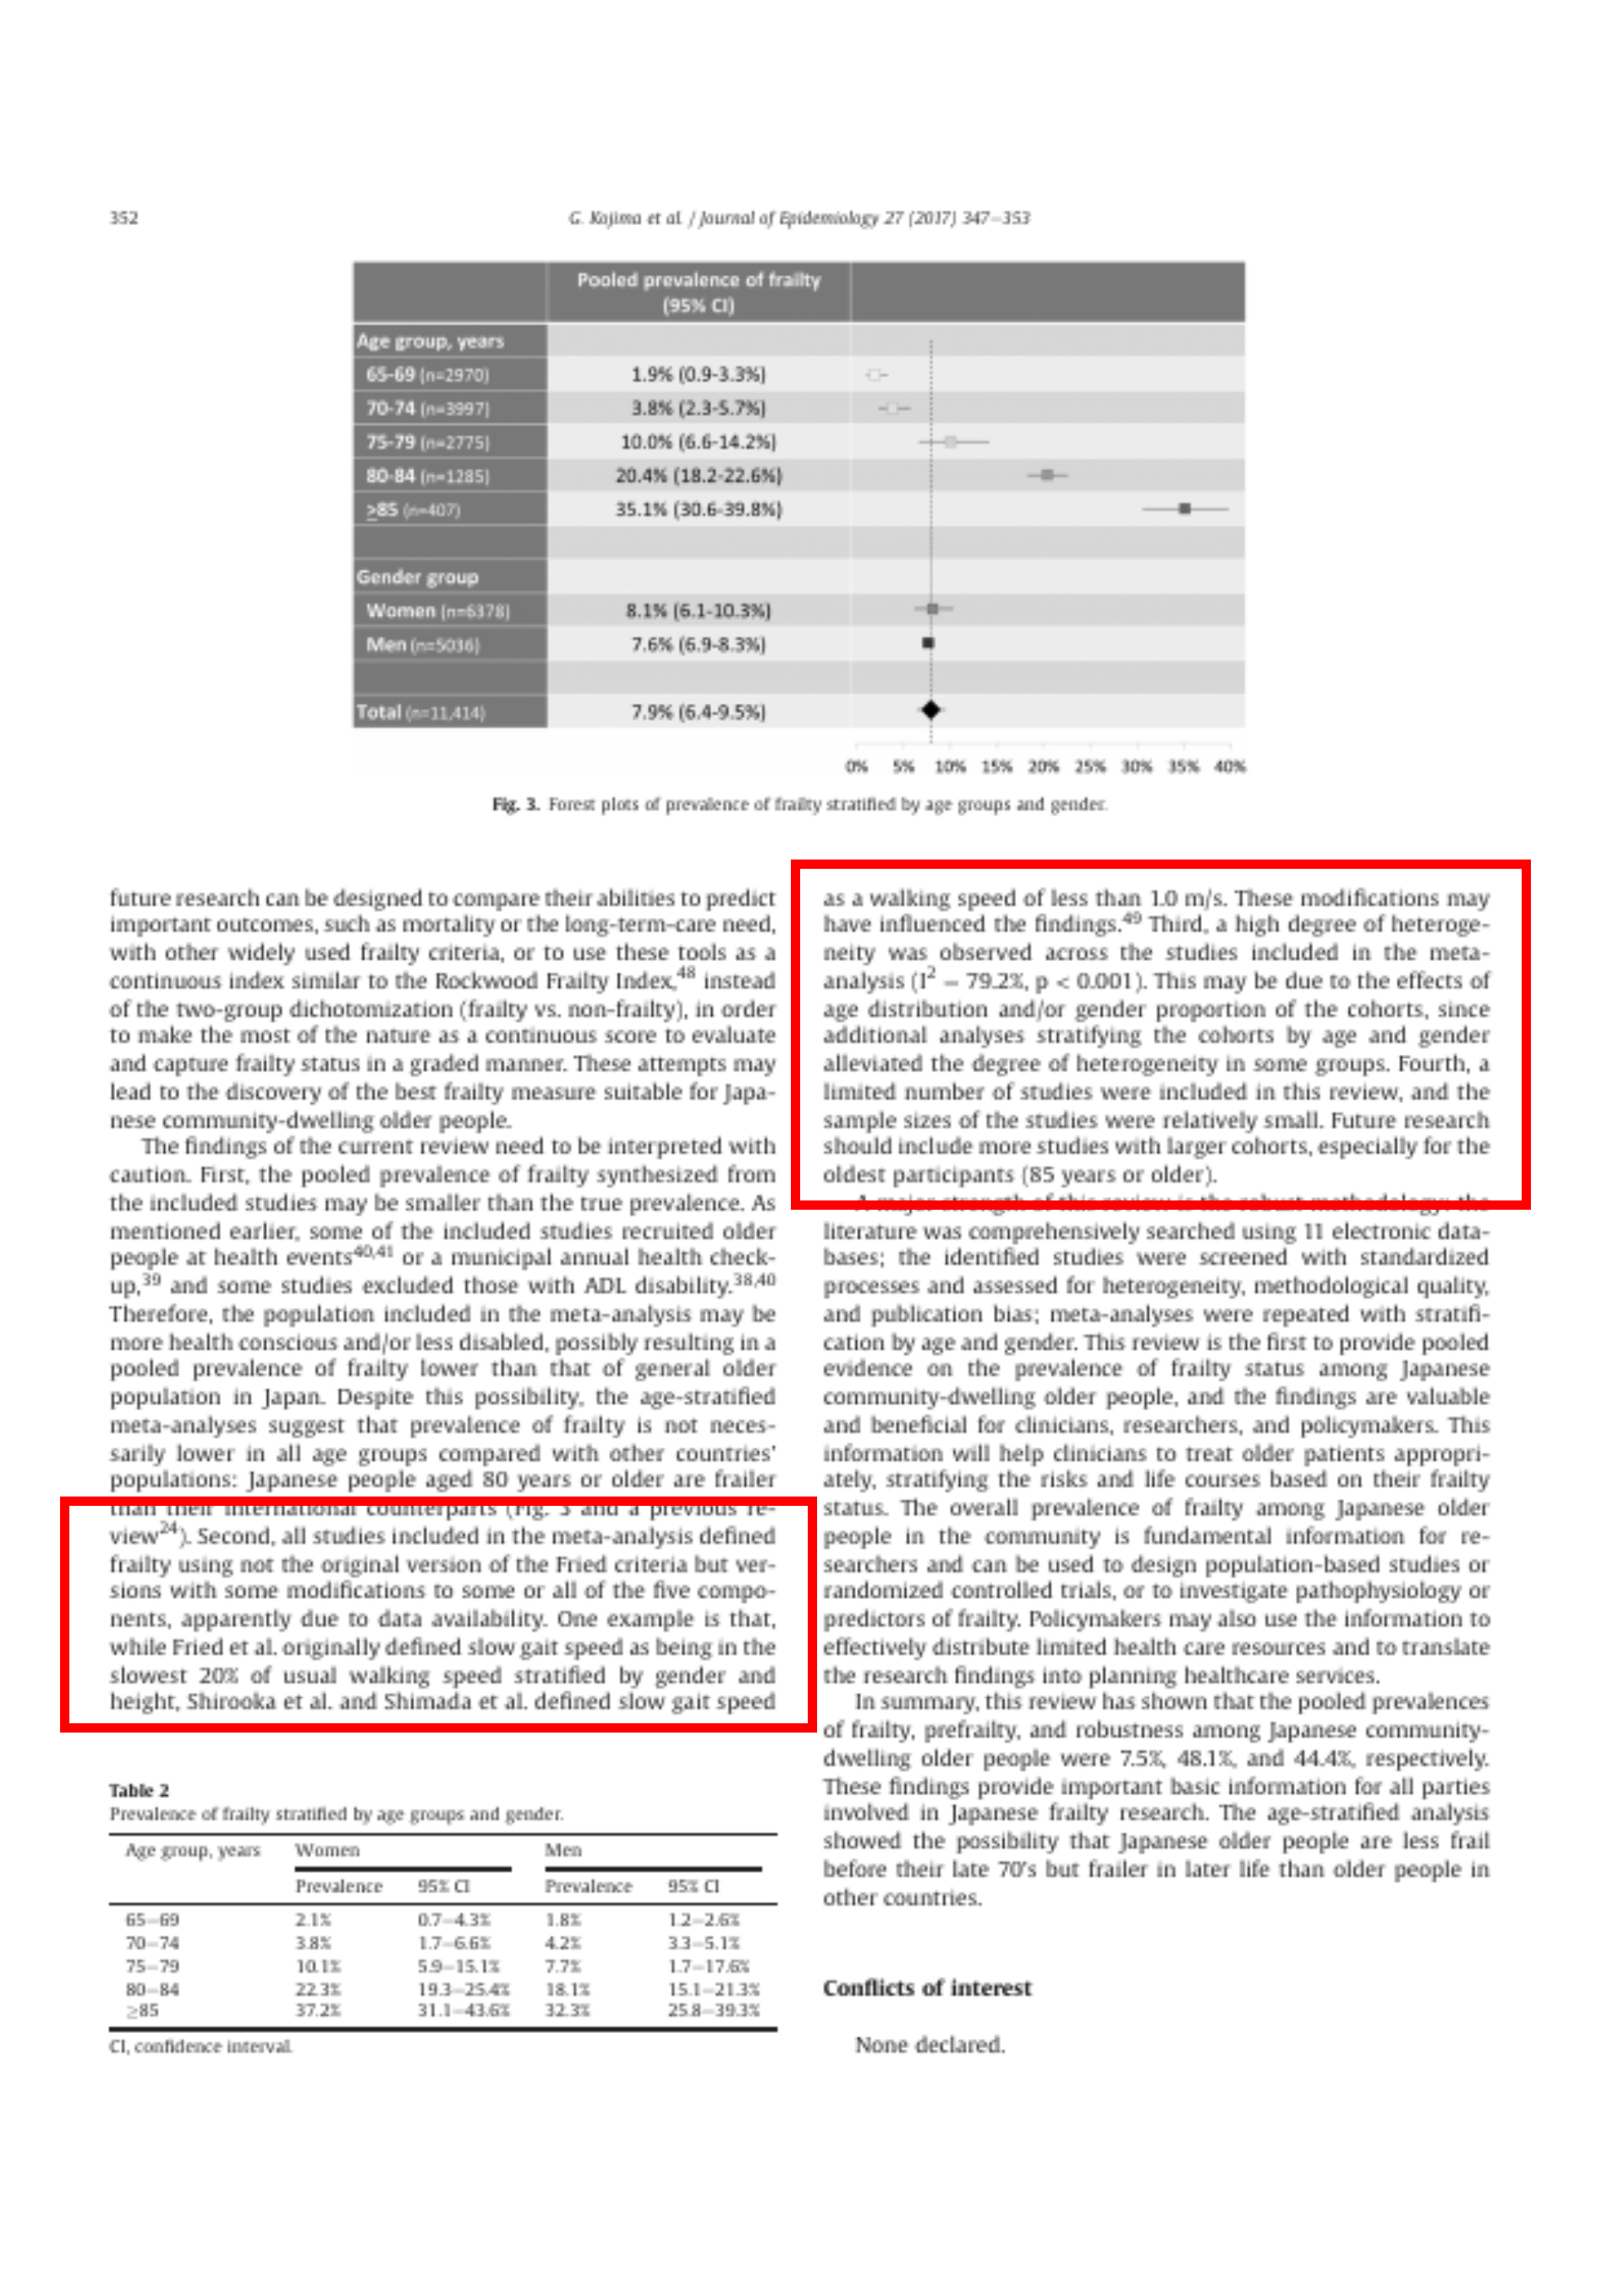
- 5つの年齢群(65-69歳、70-74歳、75-79歳、80-84歳、≧85歳)におけるフレイルの統合有病率は、それぞれ1.9%、3.8%、10.0%、20.4%、35.1%
- 女性は8.1%、男性で7.6%
- 70-74歳を除くほとんどの年齢層で、男性より女性の方がフレイルが多い
Changes in heterogeneity
page 350
A high degree of
- 女性(I2 = 81.8%, p < 0.001)
- 65-69歳、70-74歳、75-79歳の若い3つの年齢層では高い異質性(I2 = 68.6%-81.1%, all p < 0.05)
- 男性(I2 = 42.4%、p=0.18)
- 80-84歳と≧85歳の高齢者群(I2 =0%-54.2%、すべてp>0.05)では、高い異質性が性別と年齢による変動で部分的に説明できる
Forest plot
Discussion
page 350
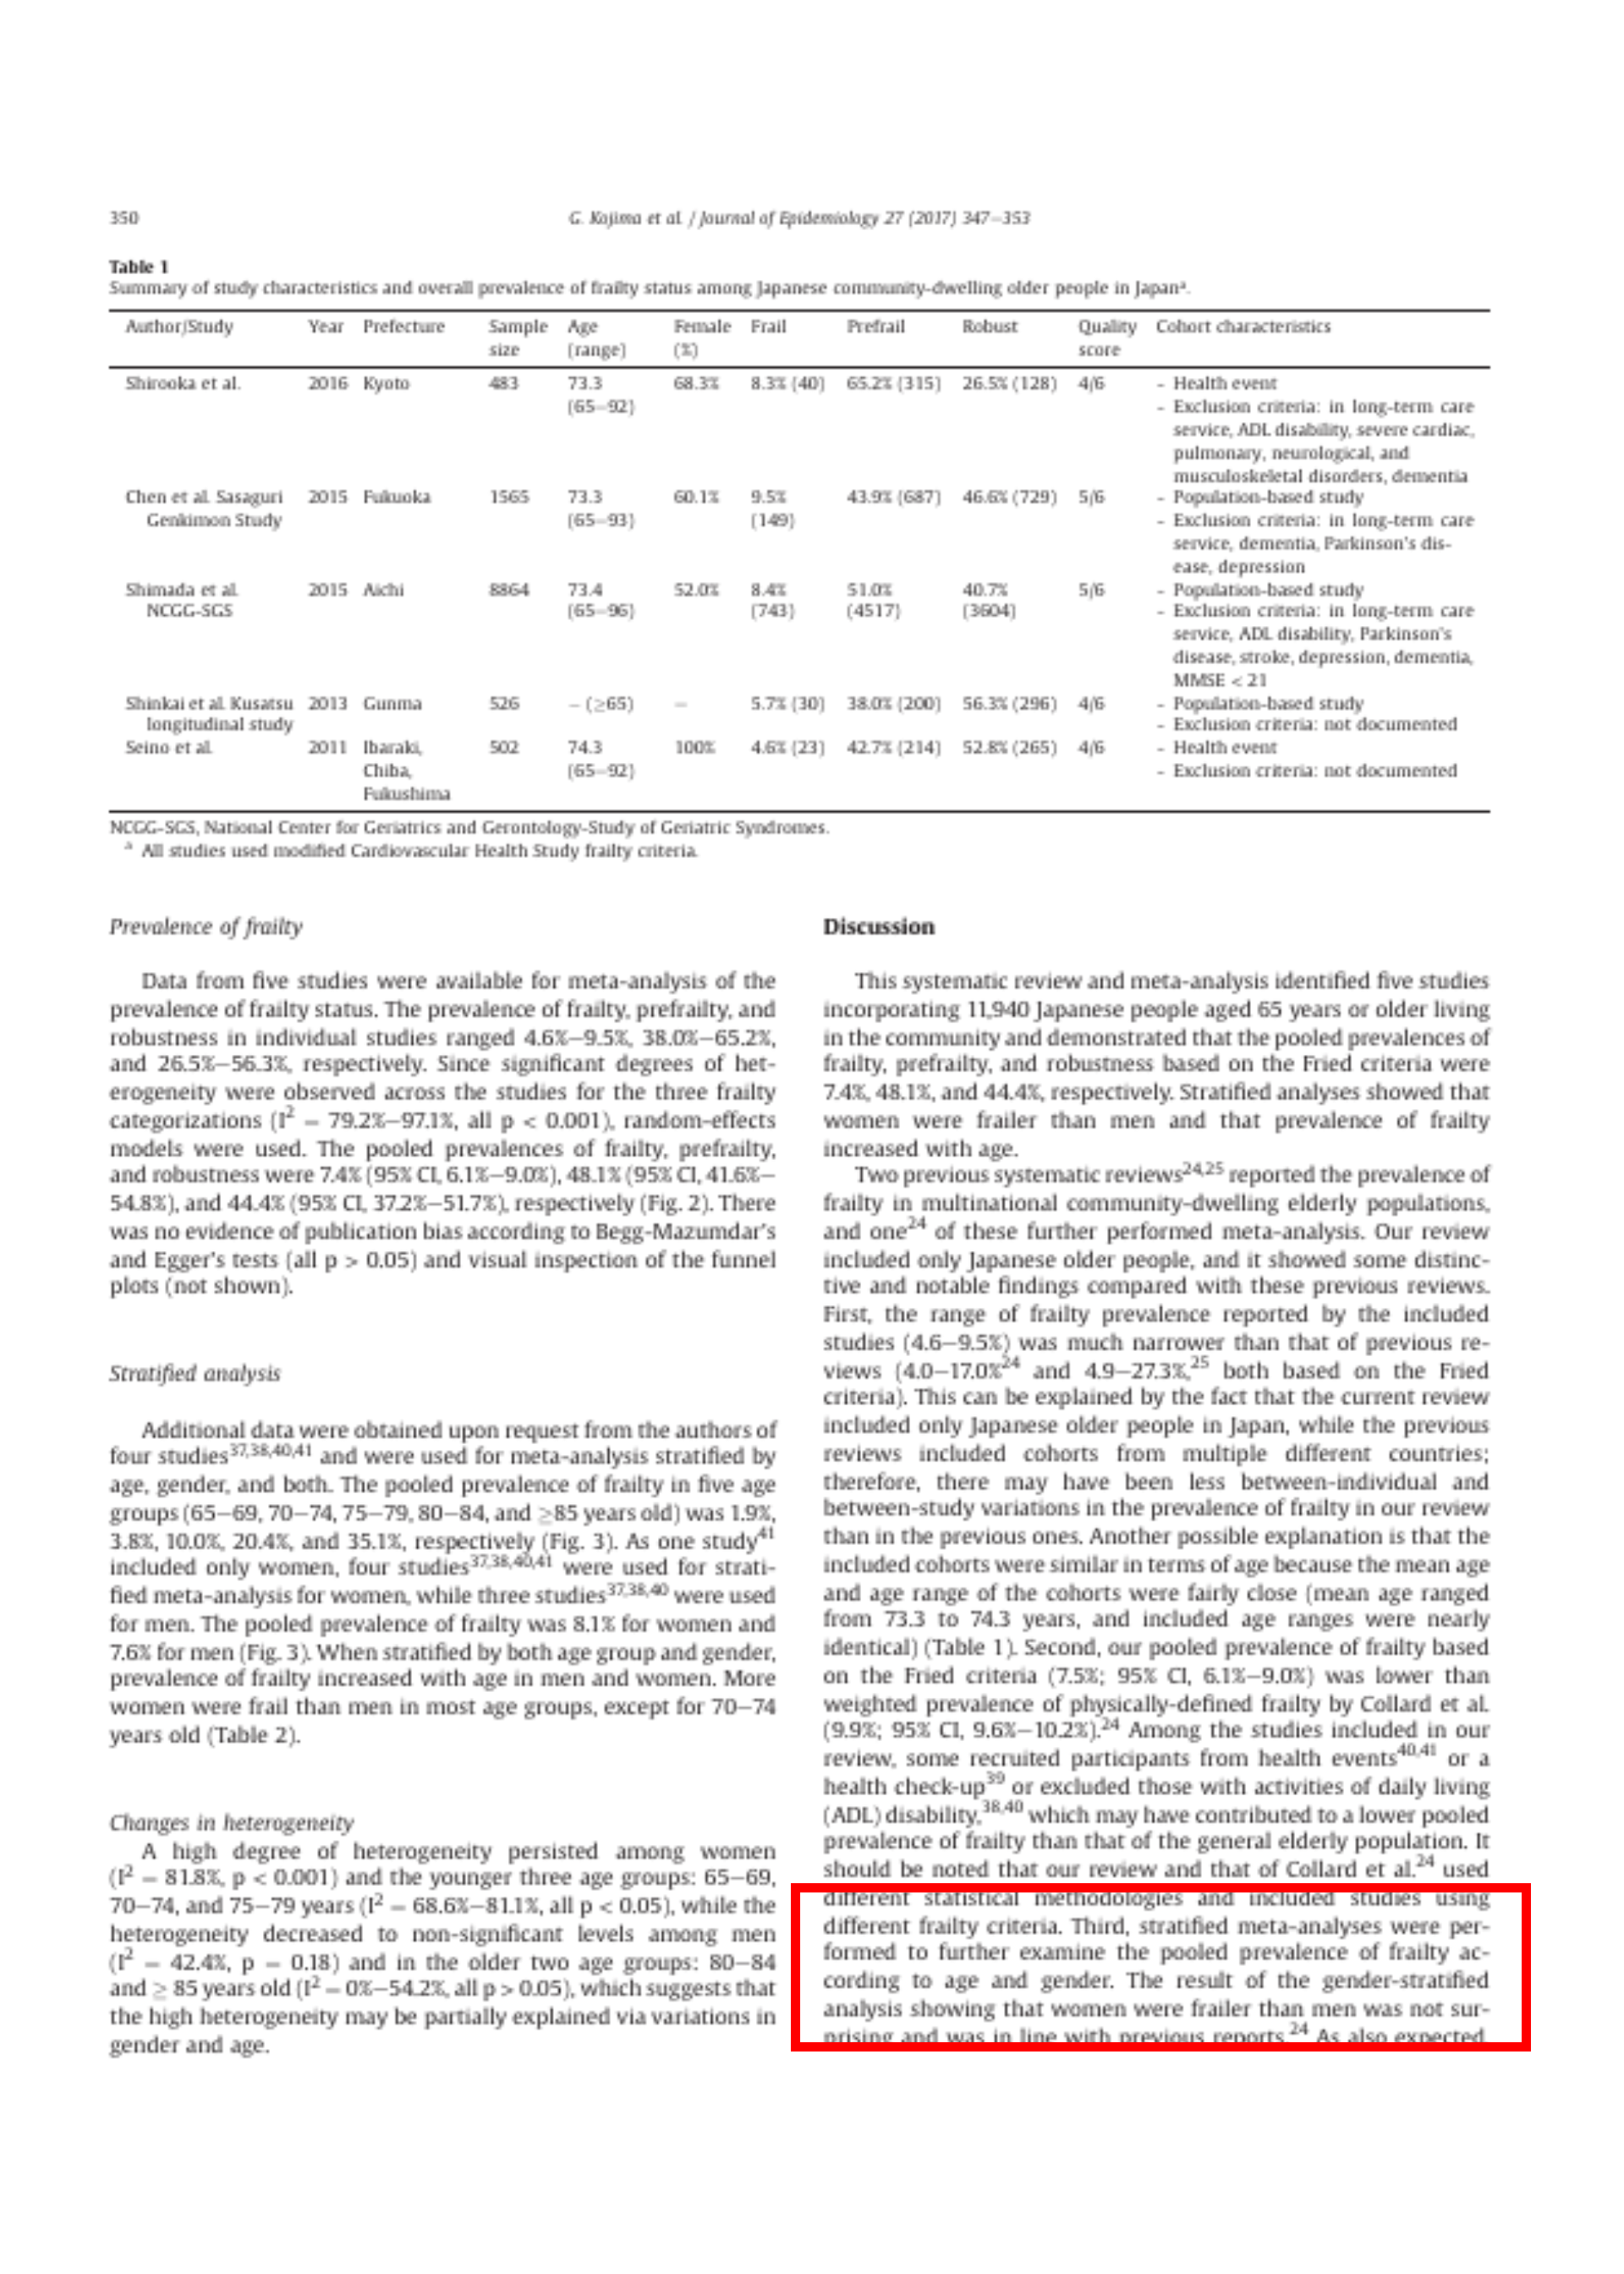
This systematic review and meta-analysis identified five studies incorporating 11,940 Japanese people aged 65 years or older living in the community and demonstrated that the pooled prevalences of frailty, prefrailty, and robustness based on the Fried criteria were 7.4%, 48.1%, and 44.4%, respectively. Stratified analyses showed that women were frailer than men and that prevalence of frailty increased with age.
Quiz Discussion の第1段落には何が書かれているか?
- 先行研究の要約
- 結果の要約
- 地域在住の65歳以上の日本人11,940人を組み入れた5つの研
- フレイル: 7.4%
- プレフレイル: 48.1%
- 頑健: 44.4%
- 女性は男性よりもフレイル
- 年齢とともに増加する

page 350
community-dwelling: 地域在住
meta-analysis: メタ分析
mean: 平均
Two previous systematic reviews24, 25 reported the prevalence of frailty in multinational
過去に2つの多国籍なシステマティックレビュー24, 25
今回のレビューでは、日本人高齢者のみを対象
日本のフレイル有病率の範囲(4.6~9.5%)は、過去のレビュー(4.0~17.0%24、4.9~27.3%)25 の範囲よりも狭い
日本の高齢者のみを対象としていたため、ばらつきが少なかったと考えられる。
対象コホートが年齢的に似ていた

page 350
pool: 統合する
recruit: 応募する
exclude: 除外する
… Second, our
- 我々のフレイルの有病率(7.5%;95%CI、6.1〜9.0%)は、Collard et al.24 による身体的に定義されたフレイルの加重有病率(9.9%;95%CI、9.6〜10.2%) よりも低い
- 健康イベント40, 41 や健康診断39 から参加者を募集、日常生活動作(ADL)に障害のある人を除外が低くする原因になっている可能性がある
- 私たちのレビューと Collard et al.24 のレビューは、異なる統計手法を用い、異なるフレイル基準を用いた研究を含んでいる
page 350
… Third,
- 女性が男性よりもフレイルであることは、これまでの報告と一致 24
- フレイルの有病率は年齢とともに確実に増加する
- 複数の国の地域在住高齢者におけるフレイル(任意のフレイル定義に基づく)の年齢層別加重有病率は、65〜69歳で約4%、70〜74歳で約7%、75〜79歳で約10%、80〜84歳で16%、85歳以上で26%
- 若い年齢層は有病率が低く(65-69歳で1.9%、70-74歳で3.8%)、75-79歳の年齢層は同程度(10.0%)、高齢層は高い(80-84歳で20.4%、85歳以上で35.1%)
- 日本人以外のフレイル高齢者は早く亡くなるため、ヒートサバイバー効果42 により後年のフレイル有病率が低くなる可能性
page 351
disability: 障害
institutionalization: 施設入所
There are two tools that have been developed and used in Japan for identifying vulnerable older adults with high risks not specifically for frailty but for general adverse health outcomes, such as dependency,
Quiz institutiolization の意味は何か?
- 施設入所
- 制度化
- 日本では、フレイルを特定するためのツールが2つある
page 351
The Kihon Checklist (KCL) is a self-reported comprehensive questionnaire consisting of 25 simple questions covering multiple domains of instrumental ADL, physical function, oral function, nutrition, cognition, social activity, and depressive mood. The checklist was originally developed by the Japanese Ministry of Health, Labour and Welfare in 2005–2006, when the long-term care insurance system, which had originally been started in 2000, was reformed to focus more on prevention.43 This questionnaire has been widely used in Japanese local municipal offices and centers as an initial screening tool to identify at-risk older individuals and, if necessary, initiate interventional programs and facilitate various governmental long-term care and support services according to their conditions. This tool was validated as a screening tool for frailty and shown to have good-to-excellent accuracy: the
基本Checklist(KCL)
- 手段的ADL、身体機能、口腔機能、栄養、認知、社会活動、抑うつ気分
- 25の簡単な質問からなる自己報告型
- フレイルを予測するAUCは0.9244
- 地域在住の高齢者のサンプルにおいてはAUC = 0.88 45
- KCL に基づいて 38.0%がフレイルと判定46
- フレイルはフレイルでない参加者に比べて介護保険の認定を受ける確率が有意に高かった(OR 3.80; 95% CI, 3.02-4.78 )46
page 351
Another tool is the Frailty Index for Japanese elderly (FI-J), also known as the Kaigo-Yobo Checklist, which is a 15-item questionnaire to identify older adults at high risk of becoming dependent or in need of long-term care.47 This index has also been validated for frailty screening in a
日本高齢者フレイル指標(FI-J)別名「介護予防チェックリスト」
- Fried 基準で定義されたフレイルの予測精度は高く(AUC=0.89)
- ADL困難の契機の有意な予測因子(OR 3. 42; 95% CI, 1.79-6.54 over 4 years)
- 介護認定(HR 3.50; 95% CI, 2.41-5.07 over 5 years)
- ADL困難の発症(OR 3. 42; 95% CI, 1.79-6.54 over 4 years)
- 介護認定(HR 3.50; 95% CI, 2.41-5.07 over 5 years)
- 死亡率(HR 2.43; 95% CI, 1.70-3.47 over 5 years)
- 47 S. Shinkai, N. Watanabe, H. Yoshida, et al., Research on screening for frailty: development of “the Kaigo-Yobo Checklist”, Nihon Koshu Eisei Zasshi, 57 (2010), pp. 345-354, (in Jpn)
pages 351-352
These feasible self-report questionnaires are easy to implement and have potential as frailty screening tools covering multidimensional components. Now that both have been shown to identify, with good-to-excellent accuracy, Fried-defined frail older people, future research can be designed to compare their abilities to predict important outcomes, such as mortality or the long-term-care need, with other widely used frailty criteria, or to use these tools as a continuous index similar to the Rockwood Frailty Index,48 instead of the two-group dichotomization (frailty vs. non-frailty), in order to make the most of the nature as a continuous score to evaluate and capture frailty status in a graded manner. These attempts may lead to the discovery of the best frailty measure suitable for Japanese community-dwelling older people.
- 自己報告式の質問票は、実施が容易
- 両者とも、Fried 定義のフレイル高齢者を良好な精度で同定できる
- 今後は、死亡率や要介護度などの重要なアウトカムを予測する能力を、広く用いられている他のフレイル基準と比較できる
- 2グループ(フレイル/非フレイル)ではなくロックウッド式フレイル指数48 と同様の連続指数として使用したりする研究を計画できる
page 352
The findings of the current review need to be interpreted with caution. First, the
- 対象となった研究から合成されたフレイルの統合有病率は、真の有病率よりも小さい可能性
- 健康イベント40, 41 や自治体の年次健康診断で高齢者を募集している39
- ADL障害のある人を除外した研究38, 40
- 日本人の80歳以上の高齢者は、海外の高齢者に比べてフレイルである
page 352
… Second, all studies included in the meta-analysis defined frailty using not the original version of the Fried criteria but versions with some modifications to some or all of the five components, apparently due to data availability. One example is that, while Fried et al. originally defined slow gait speed as being in the slowest
Quiz 数値と記号の間に半角スペースが入るのはどれか?
- 数値 + 単位
- 変数 等号・不等号 数値
- 数値 %
「歩行速度が遅い」の定義
- Fried et al.: 性別と身長で層別した通常の歩行速度の最も遅い20%
- Shirooka et al. と Shimada et al.: 1.0 m/s 未満
研究間で高い異質性が観察された(I2 = 79.2%, p < 0.001)。
研究の数とサンプルサイズが小さかった

page 352
A major
Quiz 本研究の強みとして正しいものはどれか?
- 5つのデータベースを使った
- 異質性、方法論の質、出版バイアスについて評価した
強み
- 11の電子データベース
- 標準的なプロセスでスクリーニングし、
- 異質性、方法論の質、出版バイアスについて評価
- 年齢と性別で層別化
page 352
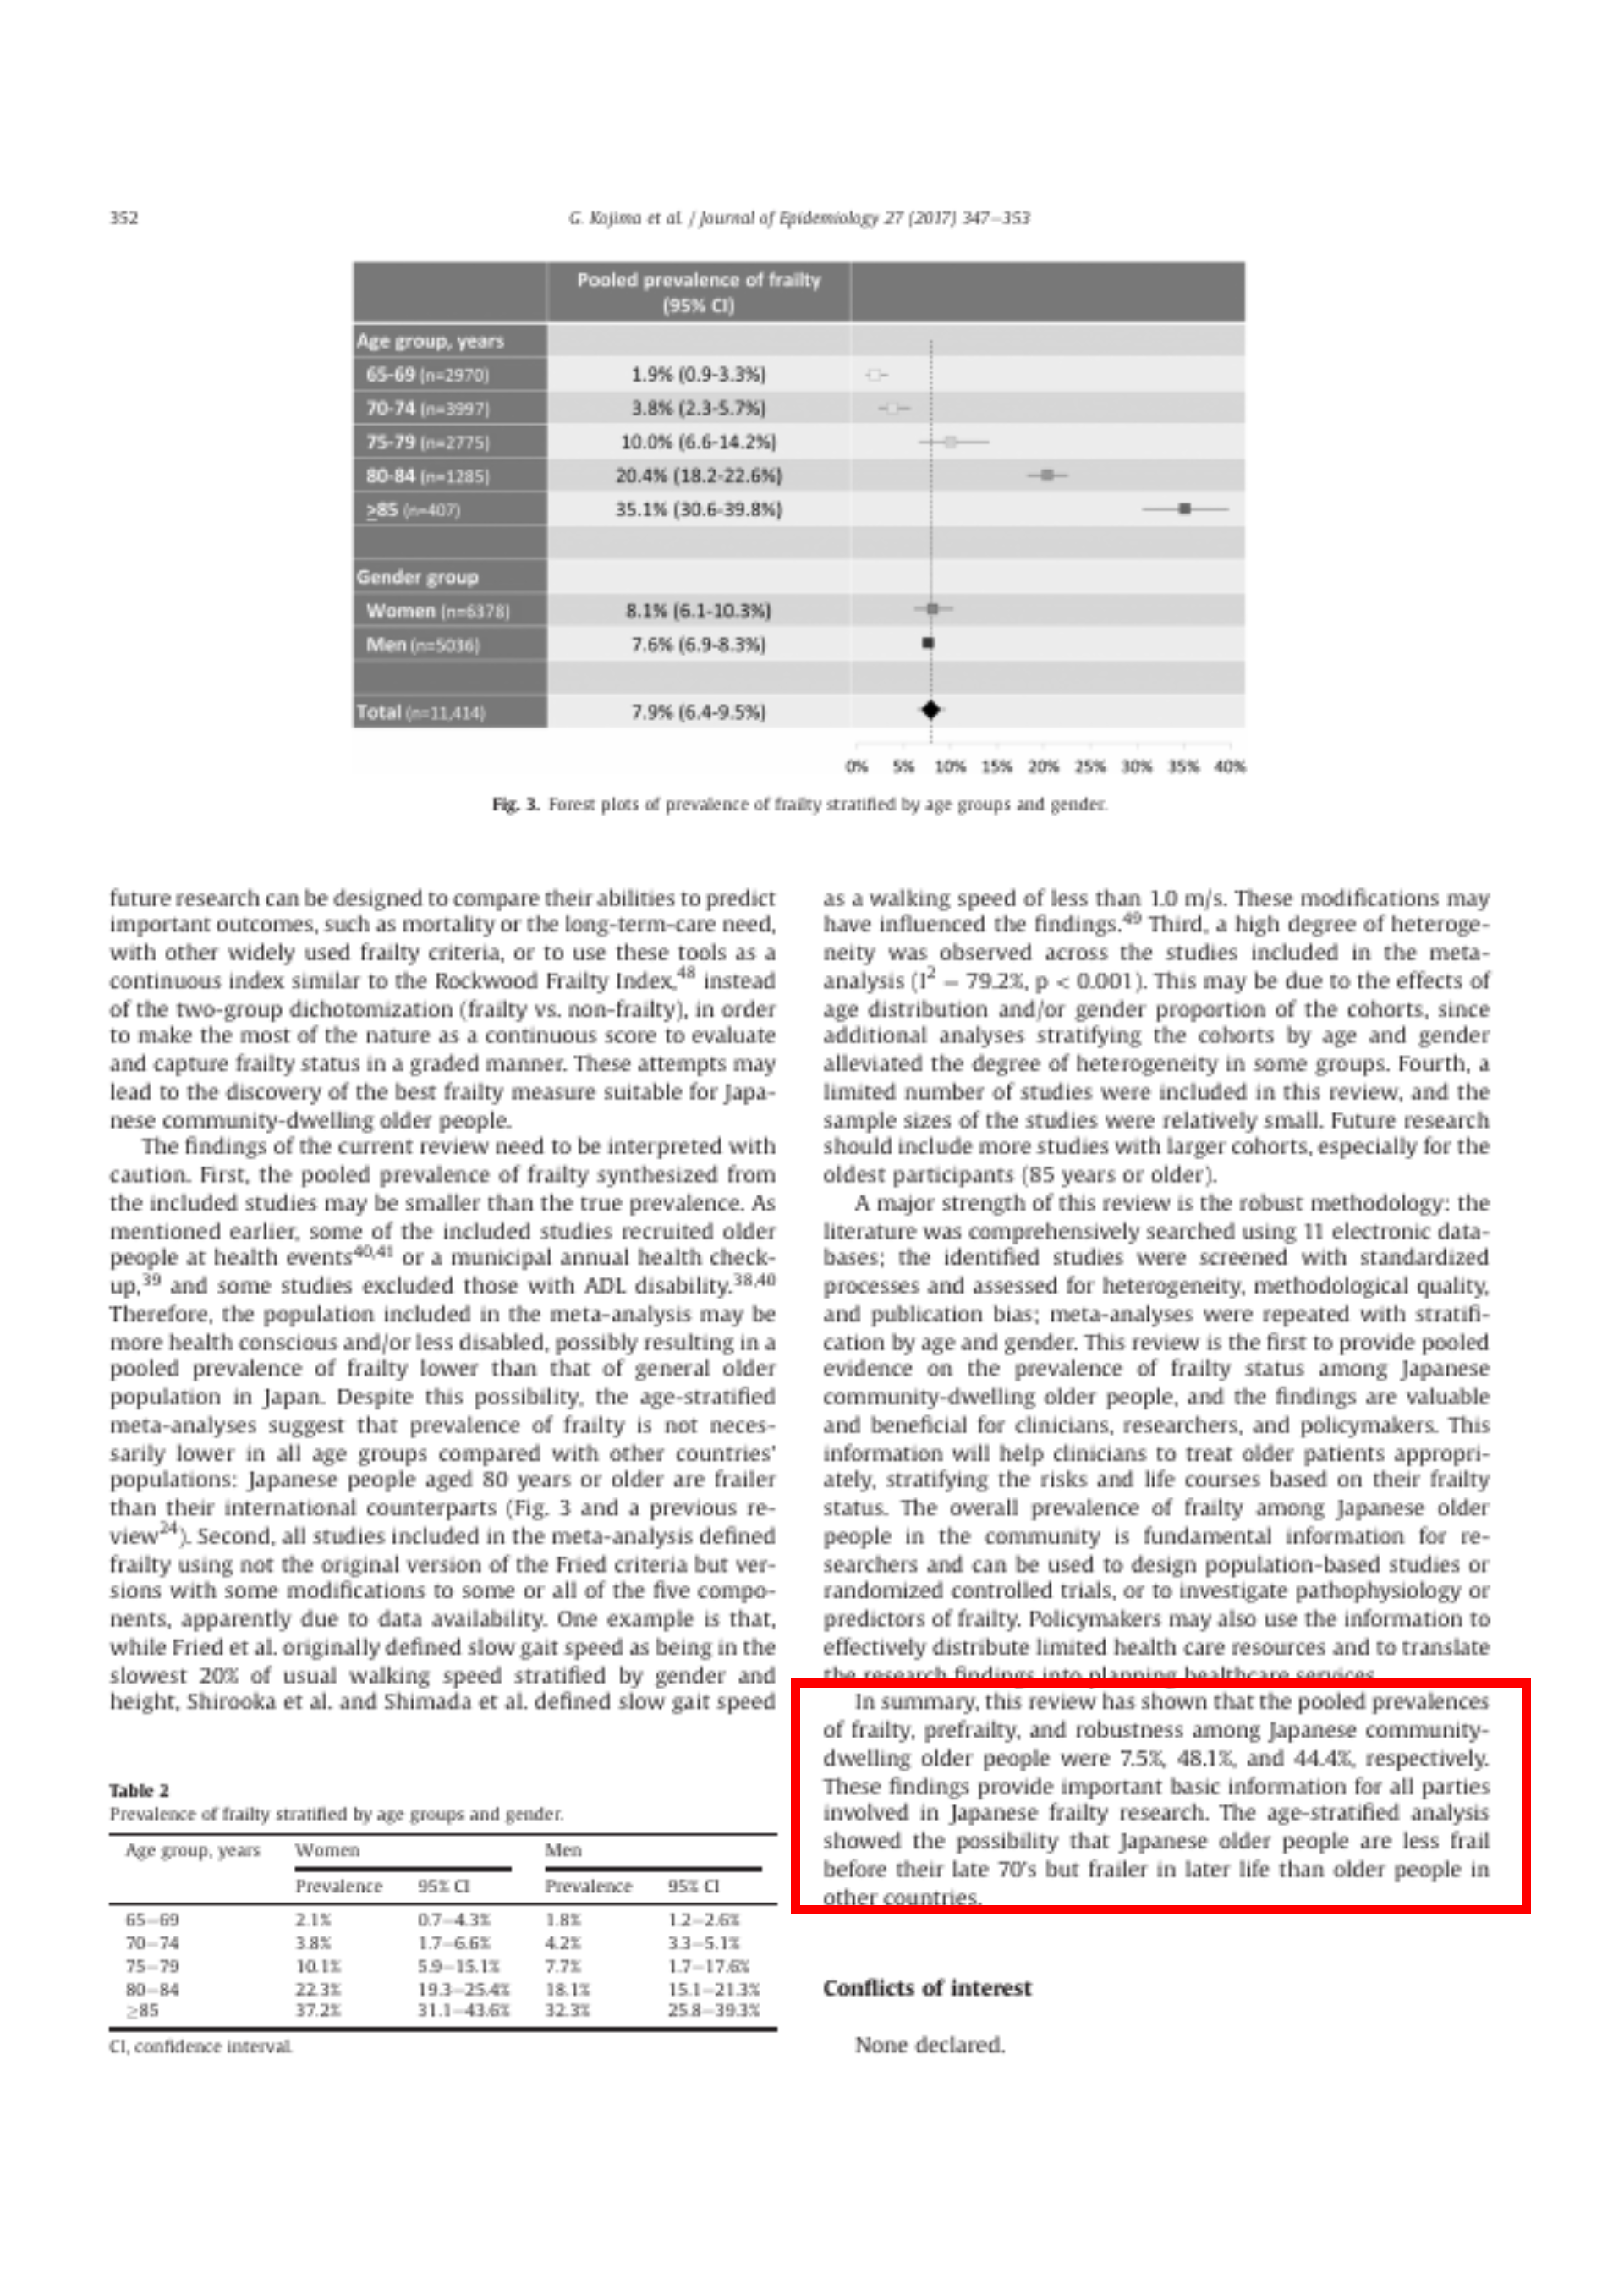
In summary, this review has shown that the
日本の地域在住高齢者における
- フレイル 7.5%
- プレフレイル 48.1%
- 頑健 44.4%
日本の高齢者は他国の高齢者に比べて、
- 70代後半まではフレイルが少ない
- それ以降はフレイルが多い
という可能性が示された。