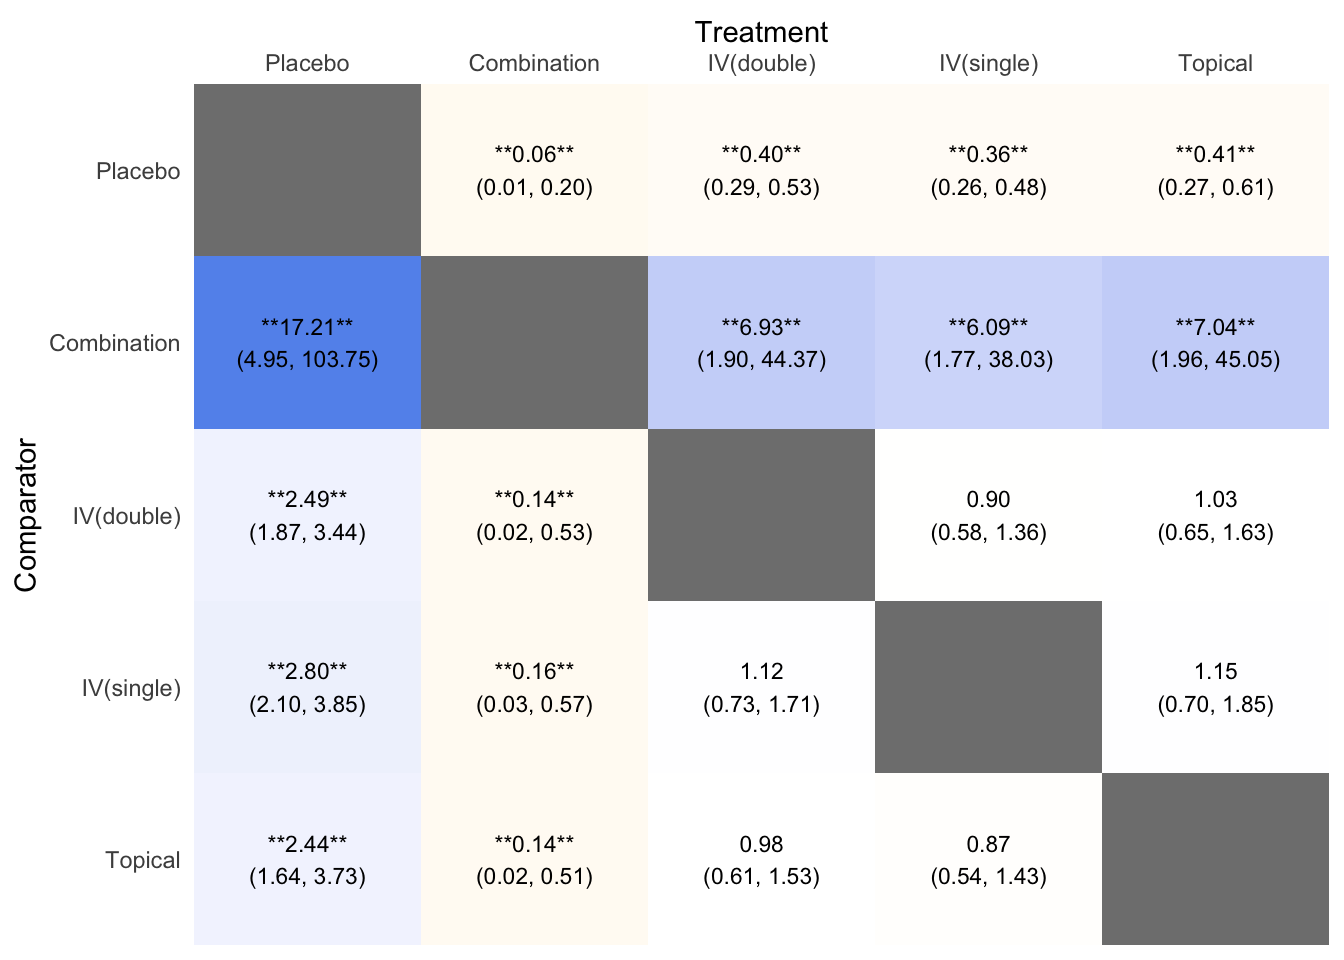
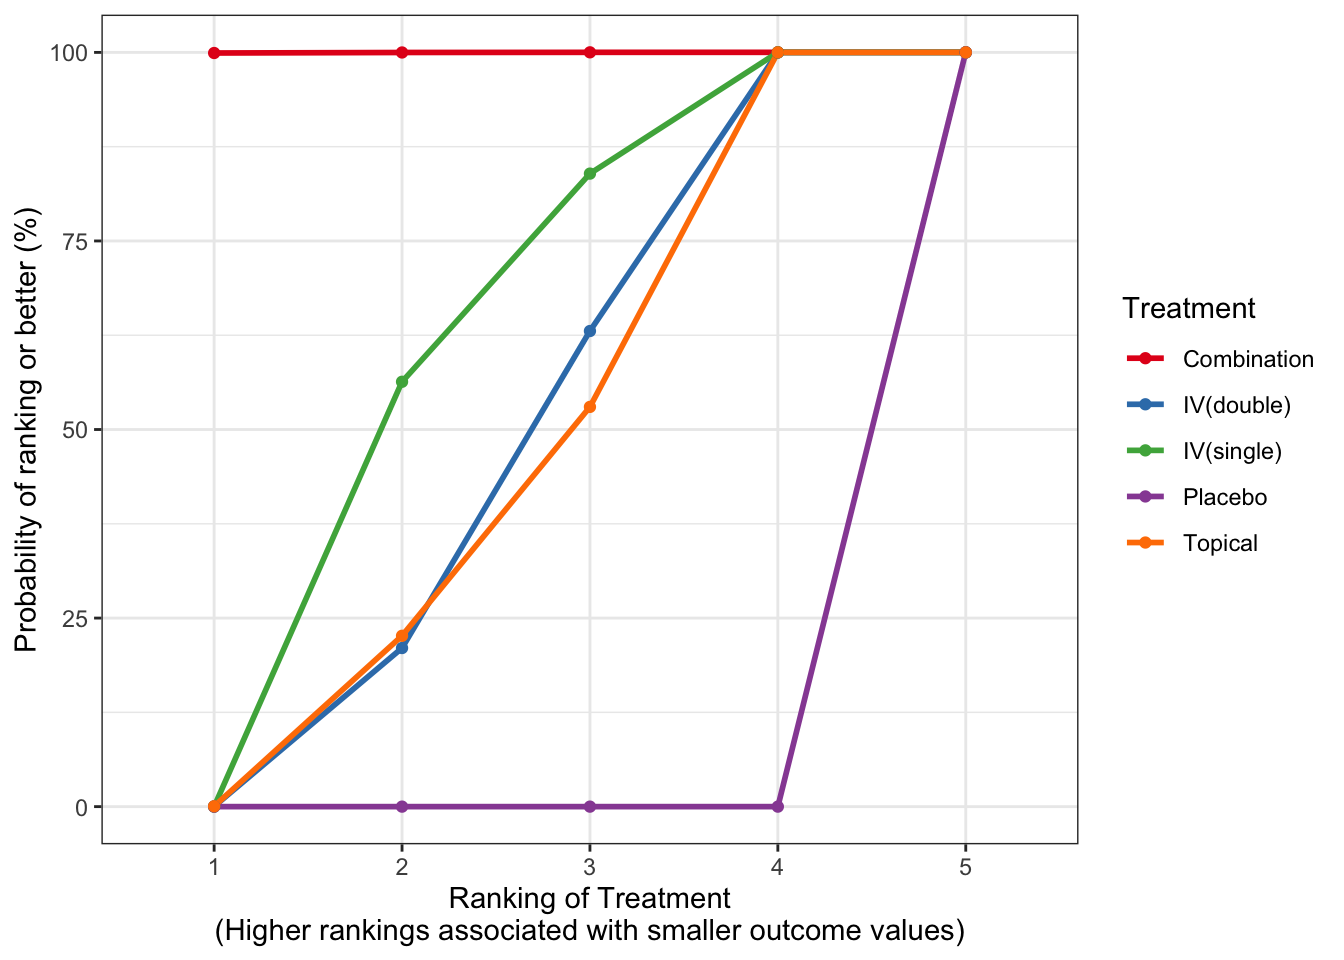
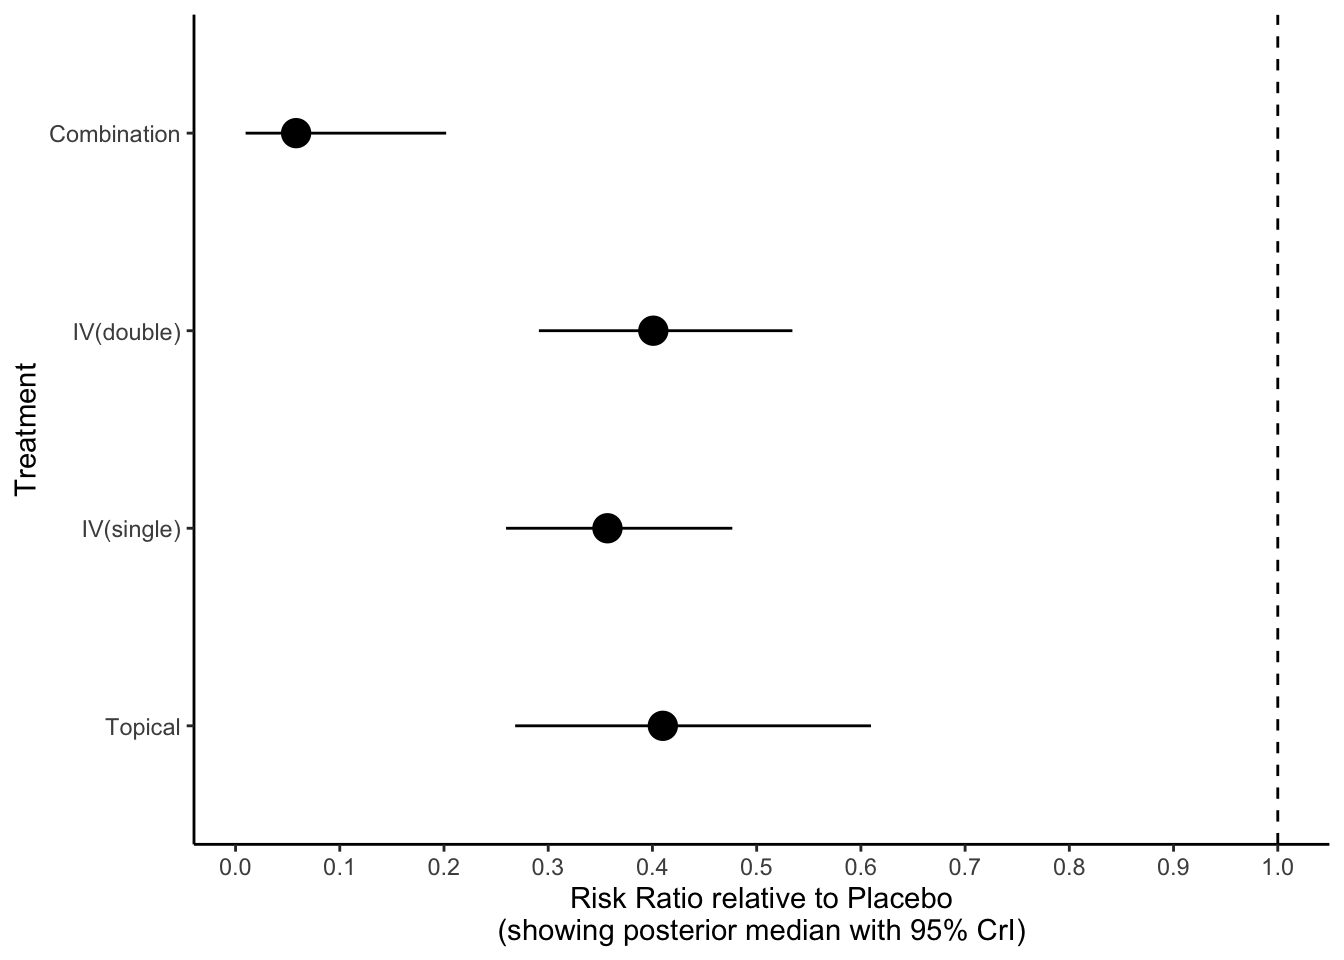
Chapter 4 Odds Ratio
4.1 はじめに
これは、アウトプットとしてオッズ比を使うパターンである。韓国疫学学会の記事を元に作成した (Shim et al. 2019)。
元データが arm-based の CSV 形式であったため、contrast-based の .xlsx に変換した。エクセルファイル中の original が、論文の提供する元データで、contrast タブが contrast-based に変換したものである。3群研究の扱いは厄介であるが、OR にする場合は単純に全ての組み合わせを列記すれば良い。また、参考のためにエクセル内で OR と lnOR を計算しておいた(元データから pairwise() 関数で計算したものと一致した)。
4.1.1 データ読み込み
arm-based と contrast-based データをあらかじめ読み込む。それぞれ、データフレーム名は dfArm と dfCon とする。
library(readxl)
dfArm <- read_excel("data/OR.xlsx", sheet = "arm")
dfCon <- read_excel("data/OR.xlsx", sheet = "contrast")

dfArm$trt <- factor(dfArm$trt, levels = c("Placebo", "IV(single)", "IV(double)", "Topical", "Combination"))
dfCon$treat1 <- factor(dfCon$treat1, levels = c("Placebo", "IV(single)", "IV(double)", "Topical", "Combination"))
dfCon$treat2 <- factor(dfCon$treat1, levels = c("Placebo", "IV(single)", "IV(double)", "Topical", "Combination"))
4.2 netmeta 頻度論
4.2.1 データ
arm-based から読み込む場合は、以下のようになる。
dfNetMeta <- pairwise(
  treat = trt,
  event = d,
  n = n,
  studlab = study,
  data = dfArm,
  sm ="OR")

netmetaShim <- netmeta(TE, seTE, treat1, treat2, studlab, data = dfNetMeta, sm="OR", reference="Placebo")
contrast-based データの場合は、以下のようになる。なお、treat1 = treat1 の左側の treat1 は、この関数の引数名である。右側の treat1 は、エクセル中の列名(データフレームの列名)である。
netmetaShim <- netmetabin(
  treat1 = treat1,
  treat2 = treat2,
  n1 = n1,
  n2 = n2,
  event1 = event1,
  event2 = event2,
  studlab = study,
  data=dfCon,
  sm="OR",
  reference="Placebo")
Xie 2016 が削除された。おそらくイベント数が0のものがあるためだろうか?arm-based データを pairwise() で計算すると、event = 0 を +0.5 して OR を計算するので、arm-based の方が良いかもしれない。
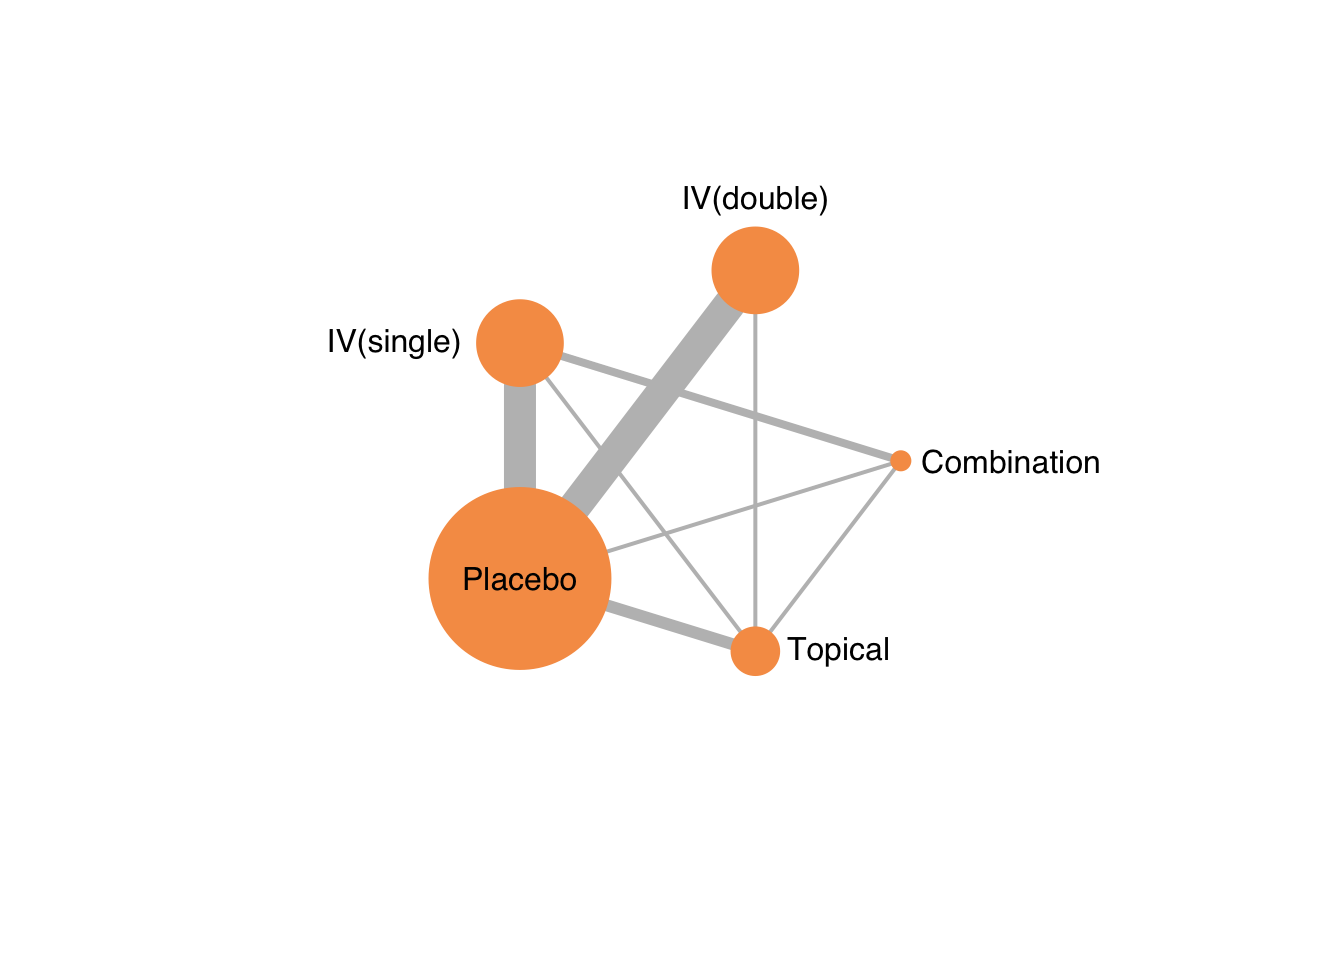
4.2.2 Network plot
netgraph(netmetaShim,
         plastic = FALSE,                    # 3Dではなくする
         points = TRUE,                      # ノードを表示する
         thickness = "number.of.studies",    # 線の太さを研究数にする
         multiarm = TRUE)                    # multiarm のところを塗りつぶす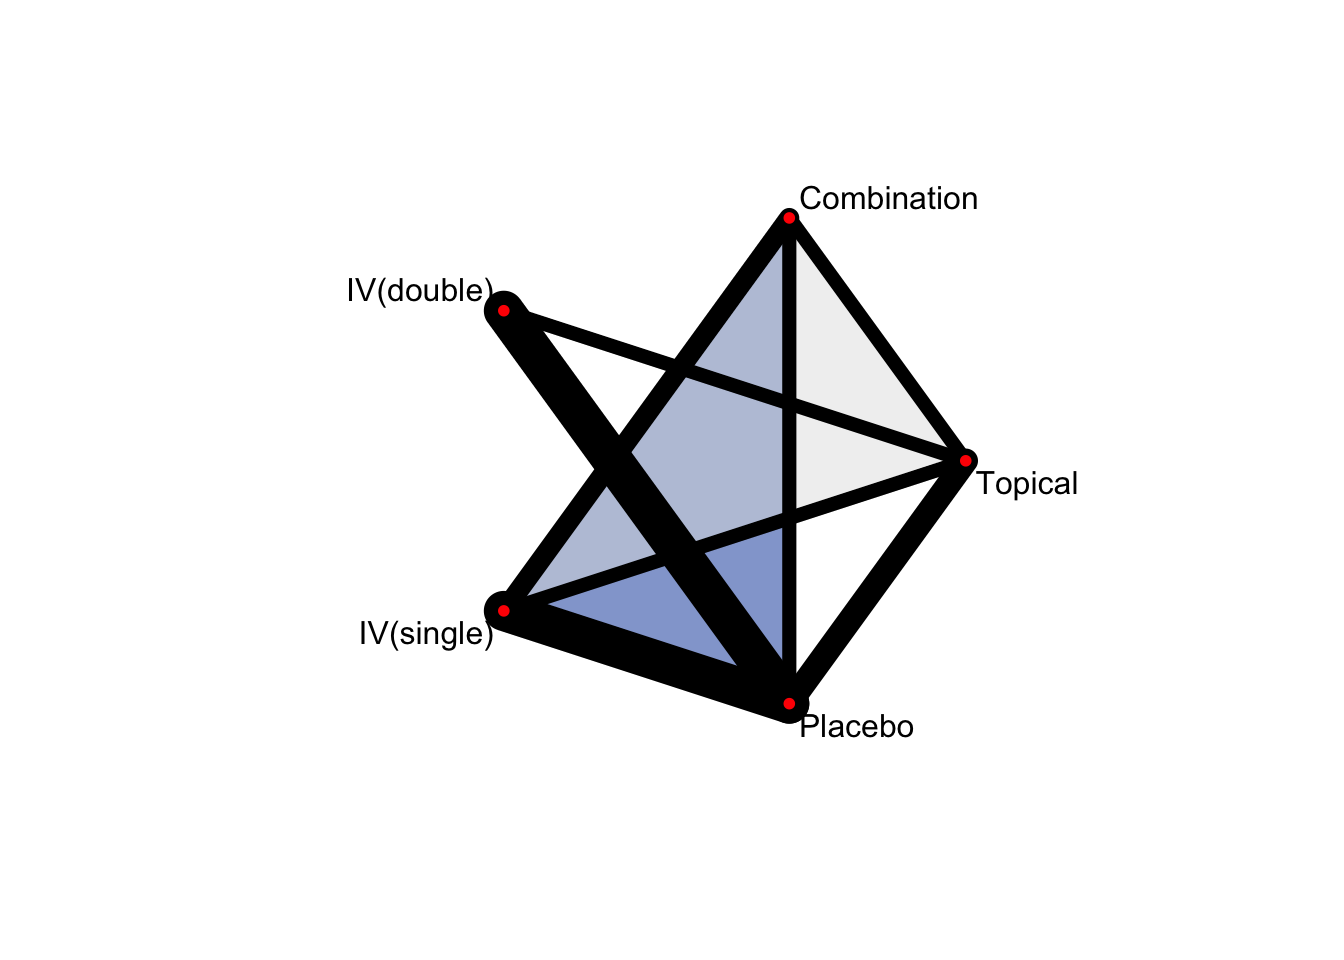
ノードの大きさを変更することはできない。
4.2.3 要約
## Original data (with adjusted standard errors for multi-arm studies):
##
##                      treat1     treat2      TE   seTE seTE.adj.f seTE.adj.r
## Alshryda 2013       Placebo    Topical  1.1967 0.4134     0.4134     0.4134
## Barrachina 2016  IV(double)    Placebo -1.5830 0.6294     0.6294     0.6294
## Benoni 2000      IV(double)    Placebo -1.5224 0.7202     0.7202     0.7202
## Benoni 2001      IV(single)    Placebo -0.8473 0.7278     0.7278     0.7278
## Claeys 2007      IV(single)    Placebo -2.0971 1.1361     1.1361     1.1361
## Fraval 2017      IV(double)    Placebo -1.8769 1.0997     1.0997     1.0997
## Husted 2003      IV(double)    Placebo -1.5782 0.8805     0.8805     0.8805
## Hsu 2015         IV(double)    Placebo -1.7918 0.8333     0.8333     0.8333
## Johansson 2005   IV(single)    Placebo -1.3184 0.4769     0.4769     0.4769
## Kazemi 2010      IV(single)    Placebo -1.1478 0.5553     0.5553     0.5553
## Lee 2013         IV(double)    Placebo -1.3783 0.5221     0.5221     0.5221
## Lemay 2004       IV(double)    Placebo -1.6205 0.6940     0.6940     0.6940
## Martin 2014         Placebo    Topical  0.6061 0.7930     0.7930     0.7930
## Niskanen 2005    IV(double)    Placebo -0.6242 0.6926     0.6926     0.6926
## North 2016       IV(double)    Topical -0.4895 0.4919     0.4919     0.4919
## Rajesparan 2009  IV(single)    Placebo -1.4046 0.7076     0.7076     0.7076
## Wang 2016        IV(single)    Placebo -1.0498 0.5106     0.5106     0.5106
## Wei 2014         IV(single)    Placebo -1.7161 0.4787     0.4787     0.4787
## Xie 2016        Combination IV(single) -1.9894 1.5214     2.2059     2.2059
## Xie 2016         IV(single)    Topical -0.2662 0.7333     0.7571     0.7571
## Xie 2016        Combination    Topical -2.2556 1.5005     1.9600     1.9600
## Yi 2016         Combination IV(single) -2.2336 1.0813     1.7199     1.7199
## Yi 2016          IV(single)    Placebo -1.1687 0.4834     0.4961     0.4961
## Yi 2016         Combination    Placebo -3.4023 1.0513     1.2990     1.2990
## Yue 2014            Placebo    Topical  1.5535 0.6863     0.6863     0.6863
##                 narms multiarm
## Alshryda 2013       2
## Barrachina 2016     2
## Benoni 2000         2
## Benoni 2001         2
## Claeys 2007         2
## Fraval 2017         2
## Husted 2003         2
## Hsu 2015            2
## Johansson 2005      2
## Kazemi 2010         2
## Lee 2013            2
## Lemay 2004          2
## Martin 2014         2
## Niskanen 2005       2
## North 2016          2
## Rajesparan 2009     2
## Wang 2016           2
## Wei 2014            2
## Xie 2016            3        *
## Xie 2016            3        *
## Xie 2016            3        *
## Yi 2016             3        *
## Yi 2016             3        *
## Yi 2016             3        *
## Yue 2014            2
##
## Number of treatment arms (by study):
##                 narms
## Alshryda 2013       2
## Barrachina 2016     2
## Benoni 2000         2
## Benoni 2001         2
## Claeys 2007         2
## Fraval 2017         2
## Husted 2003         2
## Hsu 2015            2
## Johansson 2005      2
## Kazemi 2010         2
## Lee 2013            2
## Lemay 2004          2
## Martin 2014         2
## Niskanen 2005       2
## North 2016          2
## Rajesparan 2009     2
## Wang 2016           2
## Wei 2014            2
## Xie 2016            3
## Yi 2016             3
## Yue 2014            2
##
## Results (common effects model):
##
##                      treat1     treat2     OR           95%-CI    Q leverage
## Alshryda 2013       Placebo    Topical 3.0356 [1.8197; 5.0639] 0.04     0.40
## Barrachina 2016  IV(double)    Placebo 0.2291 [0.1459; 0.3597] 0.03     0.13
## Benoni 2000      IV(double)    Placebo 0.2291 [0.1459; 0.3597] 0.00     0.10
## Benoni 2001      IV(single)    Placebo 0.2725 [0.1861; 0.3991] 0.39     0.07
## Claeys 2007      IV(single)    Placebo 0.2725 [0.1861; 0.3991] 0.49     0.03
## Fraval 2017      IV(double)    Placebo 0.2291 [0.1459; 0.3597] 0.13     0.04
## Husted 2003      IV(double)    Placebo 0.2291 [0.1459; 0.3597] 0.01     0.07
## Hsu 2015         IV(double)    Placebo 0.2291 [0.1459; 0.3597] 0.15     0.08
## Johansson 2005   IV(single)    Placebo 0.2725 [0.1861; 0.3991] 0.00     0.17
## Kazemi 2010      IV(single)    Placebo 0.2725 [0.1861; 0.3991] 0.08     0.12
## Lee 2013         IV(double)    Placebo 0.2291 [0.1459; 0.3597] 0.03     0.19
## Lemay 2004       IV(double)    Placebo 0.2291 [0.1459; 0.3597] 0.04     0.11
## Martin 2014         Placebo    Topical 3.0356 [1.8197; 5.0639] 0.40     0.11
## Niskanen 2005    IV(double)    Placebo 0.2291 [0.1459; 0.3597] 1.50     0.11
## North 2016       IV(double)    Topical 0.6953 [0.3825; 1.2639] 0.07     0.38
## Rajesparan 2009  IV(single)    Placebo 0.2725 [0.1861; 0.3991] 0.02     0.08
## Wang 2016        IV(single)    Placebo 0.2725 [0.1861; 0.3991] 0.24     0.15
## Wei 2014         IV(single)    Placebo 0.2725 [0.1861; 0.3991] 0.76     0.17
## Xie 2016        Combination IV(single) 0.1212 [0.0227; 0.6476] 0.00        .
## Xie 2016         IV(single)    Topical 0.8273 [0.4499; 1.5213] 0.01        .
## Xie 2016        Combination    Topical 0.1002 [0.0181; 0.5559] 0.00        .
## Yi 2016         Combination IV(single) 0.1212 [0.0227; 0.6476] 0.01        .
## Yi 2016          IV(single)    Placebo 0.2725 [0.1861; 0.3991] 0.07        .
## Yi 2016         Combination    Placebo 0.0330 [0.0062; 0.1752] 0.00        .
## Yue 2014            Placebo    Topical 3.0356 [1.8197; 5.0639] 0.42     0.14
##
## Results (random effects model):
##
##                      treat1     treat2     OR           95%-CI
## Alshryda 2013       Placebo    Topical 3.0356 [1.8197; 5.0639]
## Barrachina 2016  IV(double)    Placebo 0.2291 [0.1459; 0.3597]
## Benoni 2000      IV(double)    Placebo 0.2291 [0.1459; 0.3597]
## Benoni 2001      IV(single)    Placebo 0.2725 [0.1861; 0.3991]
## Claeys 2007      IV(single)    Placebo 0.2725 [0.1861; 0.3991]
## Fraval 2017      IV(double)    Placebo 0.2291 [0.1459; 0.3597]
## Husted 2003      IV(double)    Placebo 0.2291 [0.1459; 0.3597]
## Hsu 2015         IV(double)    Placebo 0.2291 [0.1459; 0.3597]
## Johansson 2005   IV(single)    Placebo 0.2725 [0.1861; 0.3991]
## Kazemi 2010      IV(single)    Placebo 0.2725 [0.1861; 0.3991]
## Lee 2013         IV(double)    Placebo 0.2291 [0.1459; 0.3597]
## Lemay 2004       IV(double)    Placebo 0.2291 [0.1459; 0.3597]
## Martin 2014         Placebo    Topical 3.0356 [1.8197; 5.0639]
## Niskanen 2005    IV(double)    Placebo 0.2291 [0.1459; 0.3597]
## North 2016       IV(double)    Topical 0.6953 [0.3825; 1.2639]
## Rajesparan 2009  IV(single)    Placebo 0.2725 [0.1861; 0.3991]
## Wang 2016        IV(single)    Placebo 0.2725 [0.1861; 0.3991]
## Wei 2014         IV(single)    Placebo 0.2725 [0.1861; 0.3991]
## Xie 2016        Combination IV(single) 0.1212 [0.0227; 0.6476]
## Xie 2016         IV(single)    Topical 0.8273 [0.4499; 1.5213]
## Xie 2016        Combination    Topical 0.1002 [0.0181; 0.5559]
## Yi 2016         Combination IV(single) 0.1212 [0.0227; 0.6476]
## Yi 2016          IV(single)    Placebo 0.2725 [0.1861; 0.3991]
## Yi 2016         Combination    Placebo 0.0330 [0.0062; 0.1752]
## Yue 2014            Placebo    Topical 3.0356 [1.8197; 5.0639]
##
## Number of studies: k = 21
## Number of pairwise comparisons: m = 25
## Number of treatments: n = 5
## Number of designs: d = 6
##
## Common effects model
##
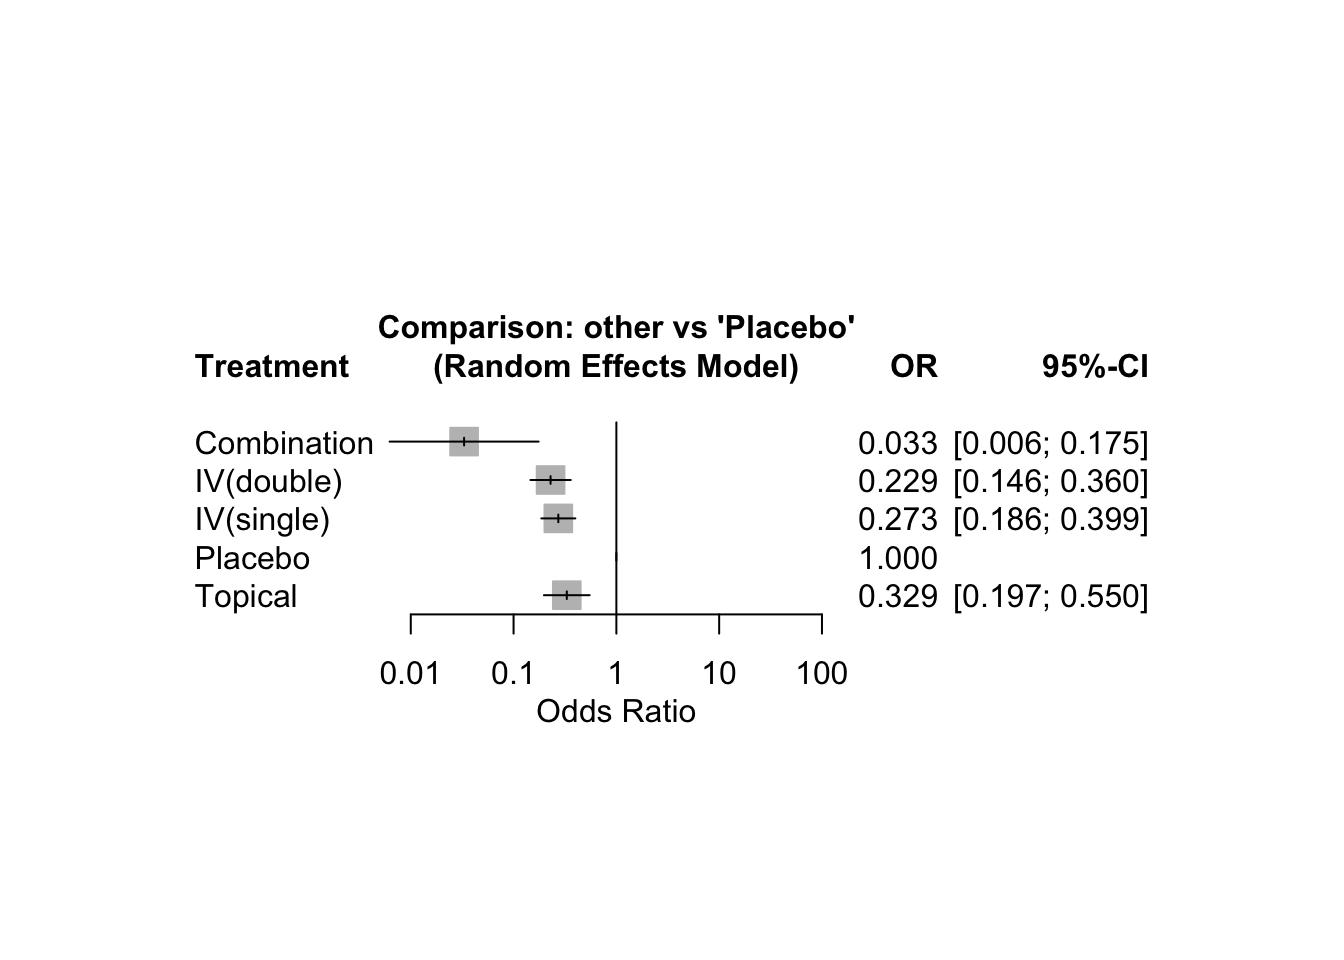
## Treatment estimate (sm = 'OR', comparison: other treatments vs 'Placebo'):
##                 OR           95%-CI     z  p-value
## Combination 0.0330 [0.0062; 0.1752] -4.01 < 0.0001
## IV(double)  0.2291 [0.1459; 0.3597] -6.40 < 0.0001
## IV(single)  0.2725 [0.1861; 0.3991] -6.68 < 0.0001
## Placebo          .                .     .        .
## Topical     0.3294 [0.1975; 0.5495] -4.25 < 0.0001
##
## Random effects model
##
## Treatment estimate (sm = 'OR', comparison: other treatments vs 'Placebo'):
##                 OR           95%-CI     z  p-value
## Combination 0.0330 [0.0062; 0.1752] -4.01 < 0.0001
## IV(double)  0.2291 [0.1459; 0.3597] -6.40 < 0.0001
## IV(single)  0.2725 [0.1861; 0.3991] -6.68 < 0.0001
## Placebo          .                .     .        .
## Topical     0.3294 [0.1975; 0.5495] -4.25 < 0.0001
##
## Quantifying heterogeneity / inconsistency:
## tau^2 = 0; tau = 0; I^2 = 0% [0.0%; 48.0%]
##
## Tests of heterogeneity (within designs) and inconsistency (between designs):
##                    Q d.f. p-value
## Total           4.90   19  0.9995
## Within designs  4.68   15  0.9945
## Between designs 0.22    4  0.9942
4.2.4 一貫性の評価
## Q statistics to assess homogeneity / consistency
##
##                    Q df p-value
## Total           4.90 19  0.9995
## Within designs  4.68 15  0.9945
## Between designs 0.22  4  0.9942
##
## Design-specific decomposition of within-designs Q statistic
##
##              Design    Q df p-value
##  Placebo:IV(double) 1.89  7  0.9655
##  Placebo:IV(single) 1.96  6  0.9229
##     Placebo:Topical 0.82  2  0.6631
##
## Between-designs Q statistic after detaching of single designs
##
##                 Detached design    Q df p-value
##              IV(double):Topical 0.12  3  0.9897
##              Placebo:IV(double) 0.12  3  0.9897
##              Placebo:IV(single) 0.19  3  0.9798
##                 Placebo:Topical 0.10  3  0.9919
##  Combination:IV(single):Topical 0.21  2  0.9019
##  Placebo:Combination:IV(single) 0.13  2  0.9363
##
## Q statistic to assess consistency under the assumption of
## a full design-by-treatment interaction random effects model
##
##                    Q df p-value tau.within tau2.within
## Between designs 0.22 4 0.9942 0 0## Separate indirect from direct evidence (SIDE) using back-calculation method
##
## Common effects model:
##
## comparison k prop nma direct indir. RoR z p-value
## Combination:IV(double) 0 0 0.144 . 0.144 . . .
## Combination:IV(single) 2 0.94 0.121 0.116 0.234 0.496 -0.19 0.8476
## Combination:Placebo 1 0.66 0.033 0.033 0.032 1.025 0.01 0.9891
## Combination:Topical 1 0.34 0.100 0.105 0.098 1.070 0.04 0.9708
## IV(double):IV(single) 0 0 0.840 . 0.840 . . .
## IV(double):Placebo 8 0.84 0.229 0.237 0.193 1.227 0.33 0.7438
## IV(double):Topical 1 0.38 0.695 0.613 0.752 0.815 -0.33 0.7438
## IV(single):Placebo 8 0.94 0.273 0.274 0.249 1.100 0.12 0.9064
## IV(single):Topical 1 0.18 0.827 0.766 0.841 0.911 -0.12 0.9081
## Topical:Placebo 3 0.65 0.329 0.308 0.374 0.824 -0.35 0.7243
##
## Random effects model:
##
## comparison k prop nma direct indir. RoR z p-value
## Combination:IV(double) 0 0 0.144 . 0.144 . . .
## Combination:IV(single) 2 0.94 0.121 0.116 0.234 0.496 -0.19 0.8476
## Combination:Placebo 1 0.66 0.033 0.033 0.032 1.025 0.01 0.9891
## Combination:Topical 1 0.34 0.100 0.105 0.098 1.070 0.04 0.9708
## IV(double):IV(single) 0 0 0.840 . 0.840 . . .
## IV(double):Placebo 8 0.84 0.229 0.237 0.193 1.227 0.33 0.7438
## IV(double):Topical 1 0.38 0.695 0.613 0.752 0.815 -0.33 0.7438
## IV(single):Placebo 8 0.94 0.273 0.274 0.249 1.100 0.12 0.9064
## IV(single):Topical 1 0.18 0.827 0.766 0.841 0.911 -0.12 0.9081
## Topical:Placebo 3 0.65 0.329 0.308 0.374 0.824 -0.35 0.7243
##
## Legend:
## comparison - Treatment comparison
## k - Number of studies providing direct evidence
## prop - Direct evidence proportion
## nma - Estimated treatment effect (OR) in network meta-analysis
## direct - Estimated treatment effect (OR) derived from direct evidence
## indir. - Estimated treatment effect (OR) derived from indirect evidence
## RoR - Ratio of Ratios (direct versus indirect)
## z - z-value of test for disagreement (direct versus indirect)
## p-value - p-value of test for disagreement (direct versus indirect)p < 0.05 であると、非一貫である。
4.3 gemtc ベイジアン
gemtc は、原則として arm-based データをとる。また、gemtc は、あらかじめ列名を指定の名称にしなければならない。
library(gemtc)
library(readxl)

dfGemtc <- dfArm
colnames(dfGemtc) <- c("study", "responders", "sampleSize", "description")
dfGemtc$treatment <- dfArm$trt
levels(dfGemtc$treatment) <- c("Placebo", "IV_single", "IV_double", "Topical", "Combination")
gemtcShim <- mtc.network(data.ab=dfGemtc)
4.3.1 Network plot
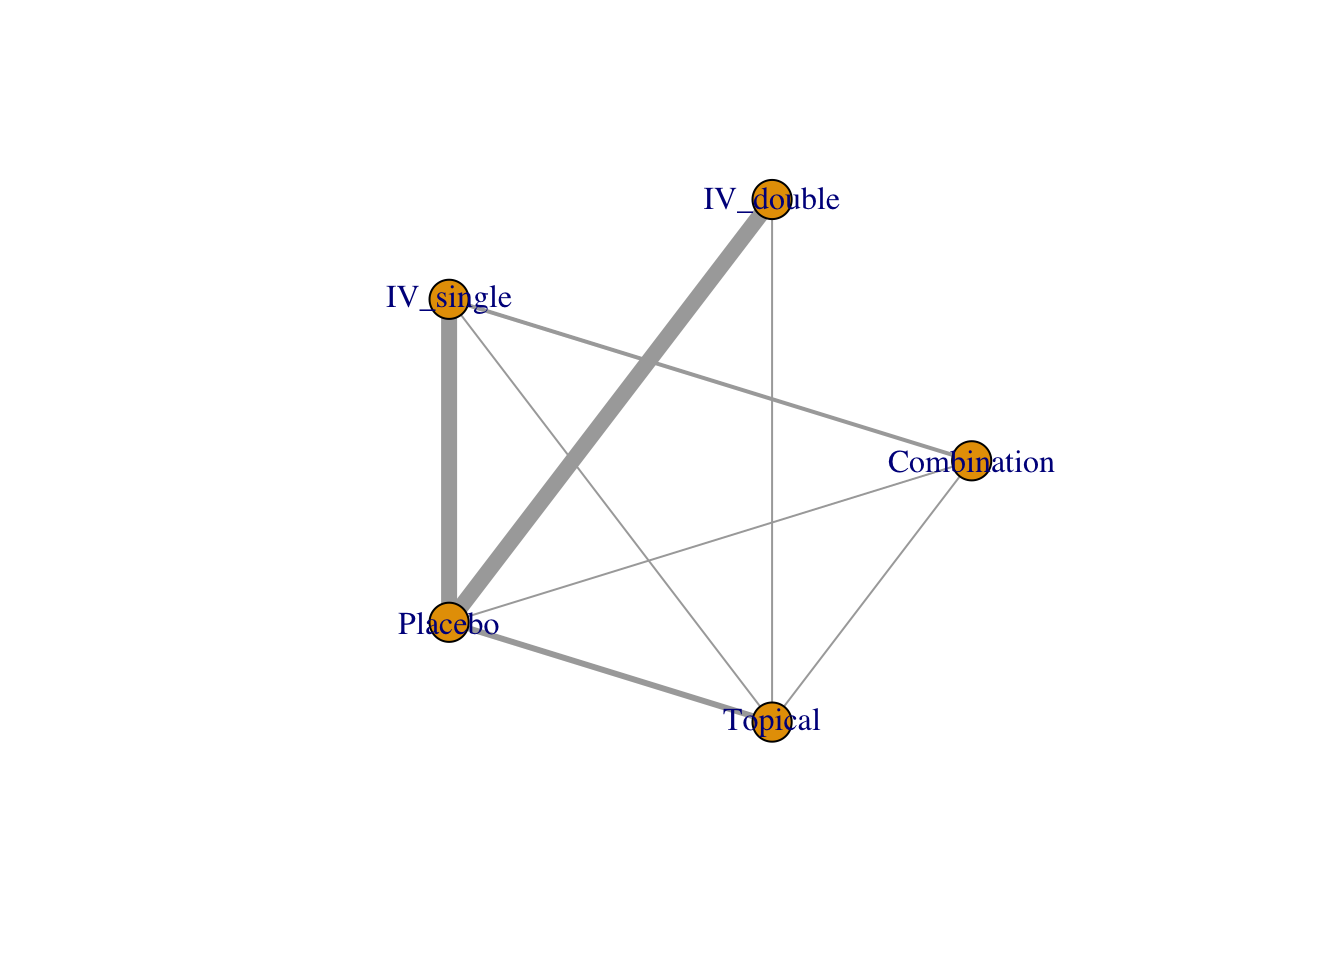
use.description で description 列を参照するはずだが、どうも機能しない。
## $Description
## [1] "MTC dataset: Network"
##
## $`Studies per treatment`
## Combination   IV_double   IV_single     Placebo     Topical
##           2           9           9          19           5
##
## $`Number of n-arm studies`
## 2-arm 3-arm
##    19     2
##
## $`Studies per treatment comparison`
##            t1        t2 nr
## 1 Combination IV_single  2
## 2 Combination   Placebo  1
## 3 Combination   Topical  1
## 4   IV_double   Placebo  8
## 5   IV_double   Topical  1
## 6   IV_single   Placebo  8
## 7   IV_single   Topical  1
## 8 Placebo Topical 34.3.3 モデル実行
## Compiling model graph
##    Resolving undeclared variables
##    Allocating nodes
## Graph information:
##    Observed stochastic nodes: 44
##    Unobserved stochastic nodes: 25
##    Total graph size: 864
##
## Initializing model##
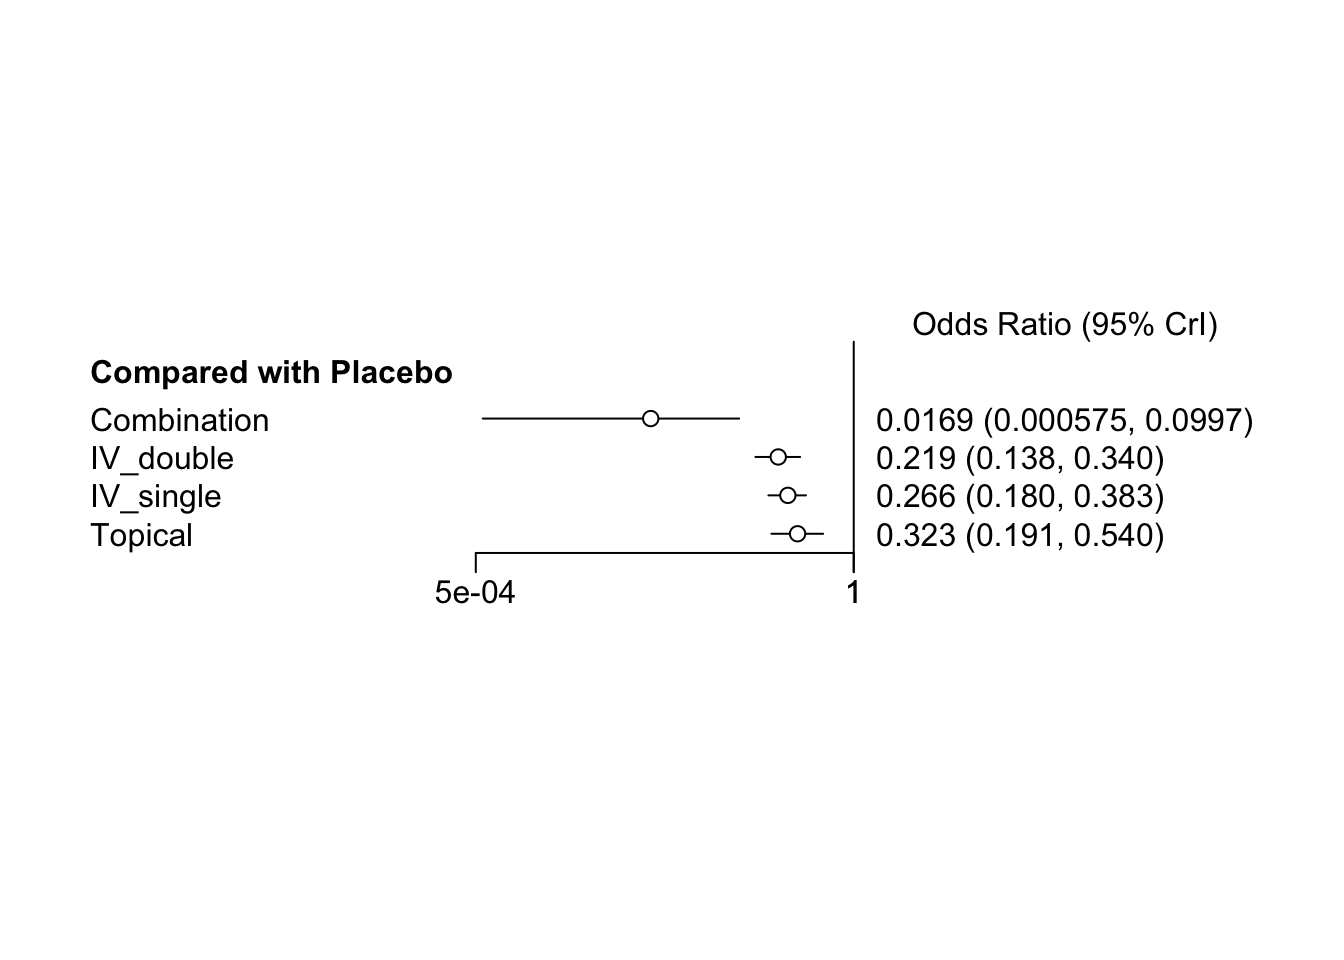
## Results on the Log Odds Ratio scale
##
## Iterations = 5010:15000
## Thinning interval = 10
## Number of chains = 4
## Sample size per chain = 1000
##
## 1. Empirical mean and standard deviation for each variable,
## plus standard error of the mean:
##
## Mean SD Naive SE Time-series SE
## d.Placebo.Combination -4.295 1.3083 0.020686 0.077451
## d.Placebo.IV_double -1.519 0.2320 0.003668 0.003856
## d.Placebo.IV_single -1.328 0.1942 0.003070 0.003220
## d.Placebo.Topical -1.133 0.2616 0.004137 0.004289
##
## 2. Quantiles for each variable:
##
## 2.5% 25% 50% 75% 97.5%
## d.Placebo.Combination -7.461 -4.978 -4.083 -3.4017 -2.3053
## d.Placebo.IV_double -1.978 -1.676 -1.519 -1.3582 -1.0775
## d.Placebo.IV_single -1.716 -1.456 -1.325 -1.1937 -0.9599
## d.Placebo.Topical -1.656 -1.307 -1.130 -0.9607 -0.6161
##
## -- Model fit (residual deviance):
##
## Dbar pD DIC
## 31.15017 25.58424 56.73441
##
## 44 data points, ratio 0.708, I^2 = 0%## Compiling model graph
## Resolving undeclared variables
## Allocating nodes
## Graph information:
## Observed stochastic nodes: 44
## Unobserved stochastic nodes: 49
## Total graph size: 936
##
## Initializing model##
## Results on the Log Odds Ratio scale
##
## Iterations = 5010:15000
## Thinning interval = 10
## Number of chains = 4
## Sample size per chain = 1000
##
## 1. Empirical mean and standard deviation for each variable,
## plus standard error of the mean:
##
## Mean SD Naive SE Time-series SE
## d.Placebo.Combination -4.5117 1.4941 0.023623 0.336161
## d.Placebo.IV_double -1.5357 0.2537 0.004012 0.013890
## d.Placebo.IV_single -1.3416 0.2174 0.003437 0.011933
## d.Placebo.Topical -1.1357 0.2912 0.004604 0.015491
## sd.d 0.1486 0.1194 0.001887 0.006327
##
## 2. Quantiles for each variable:
##
## 2.5% 25% 50% 75% 97.5%
## d.Placebo.Combination -8.699113 -5.0971 -4.193 -3.5369 -2.4016
## d.Placebo.IV_double -2.035291 -1.7118 -1.528 -1.3669 -1.0637
## d.Placebo.IV_single -1.757677 -1.4867 -1.348 -1.2020 -0.9210
## d.Placebo.Topical -1.704984 -1.3265 -1.124 -0.9429 -0.5817
## sd.d 0.002517 0.0515 0.124 0.2161 0.4460
##
## -- Model fit (residual deviance):
##
## Dbar pD DIC
## 32.36973 27.43749 59.80722
##
## 44 data points, ratio 0.7357, I^2 = 0%4.3.4 収束の評価
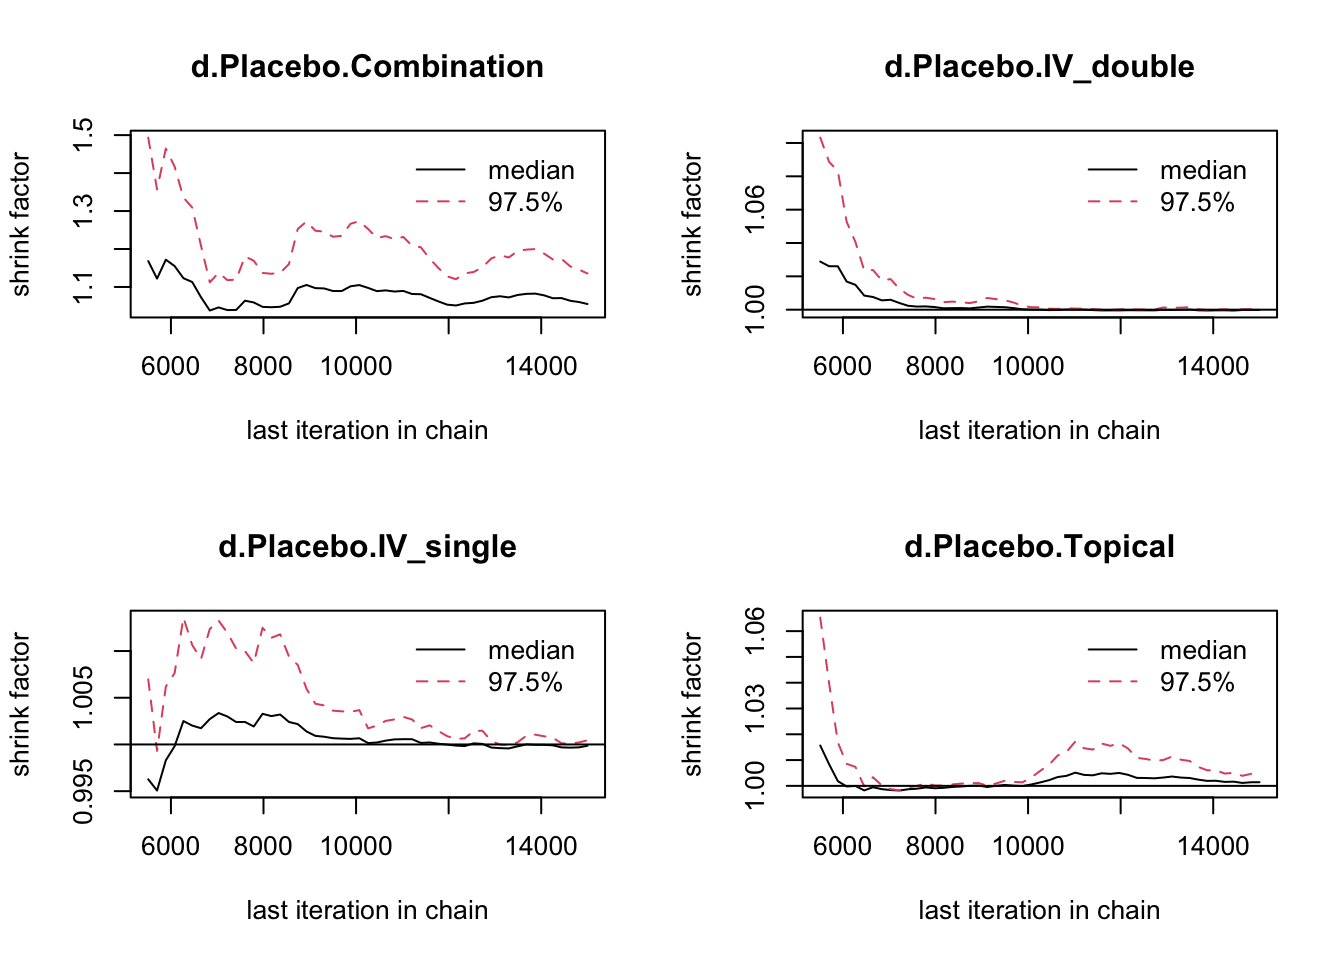
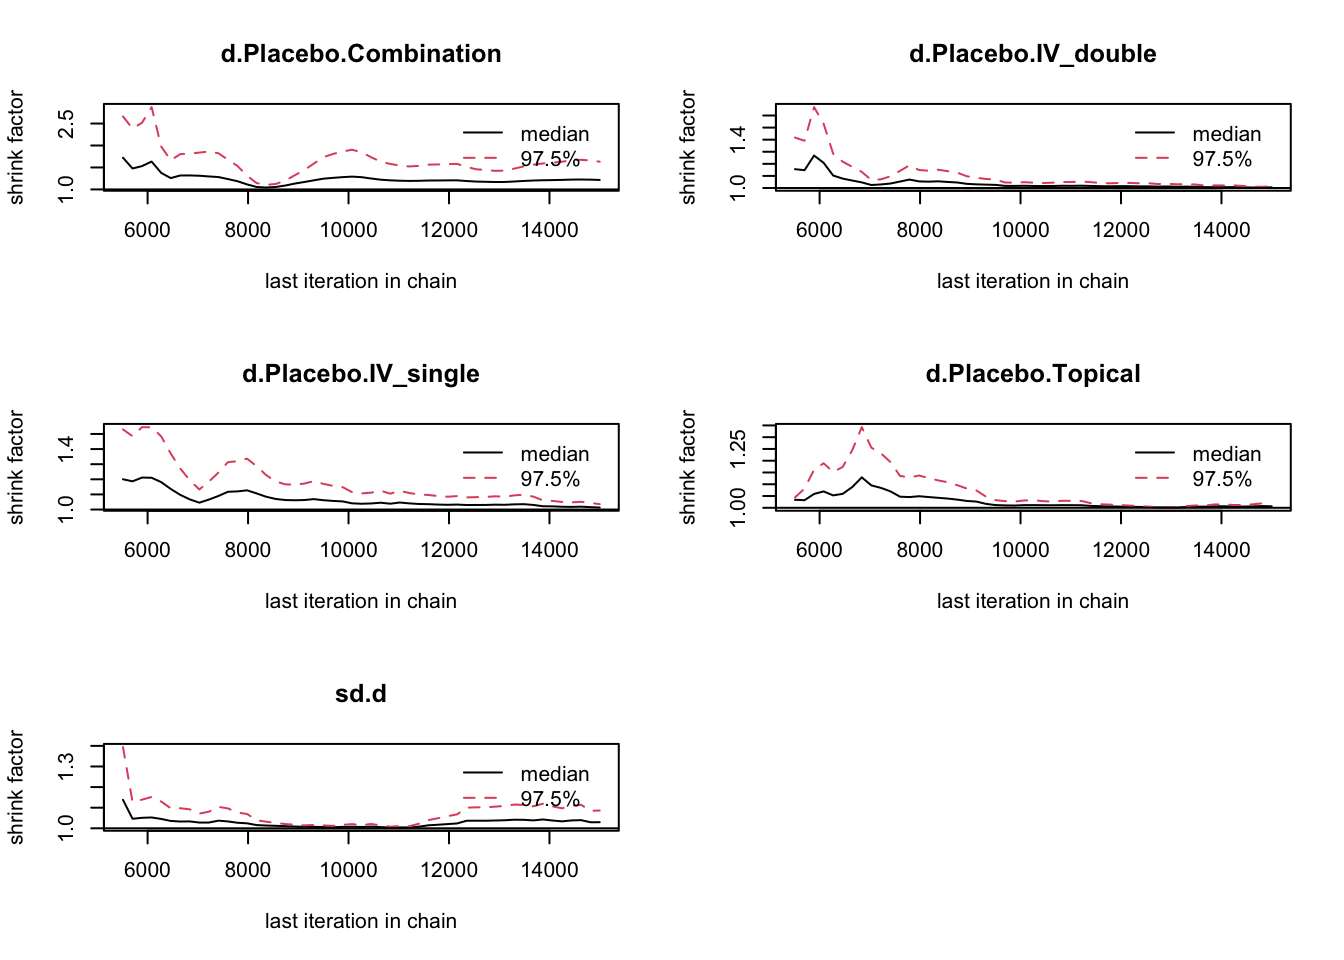
DIC は低い方が良い。Fixed が 56.3、Random が59.1。
## [1] 1.034248## [1] 1.1069451 に近い方が良い。
DIC と Gelman 値より、固定効果を採用。
4.3.6 一貫性の評価
エラーが出るため、検証中。
4.4 BUGSnet ベイジアン
BUGSnet では、arm-based データのみ対応している。
4.4.3 要約
TabBugsShim <- net.tab(data = BugsShim,
                        outcome = "d",
                        N = "n",
                        type.outcome = "binomial",
                        time = NULL)
TabBugsShim$intervention
## # A tibble: 5 × 7
## trt n.studies n.events n.patients min.outcome max.outcome av.outcome
## <chr> <int> <int> <int> <dbl> <dbl> <dbl>
## 1 Combination 2 1 120 0 0.02 0.00833
## 2 IV(double) 9 46 299 0.02 0.45 0.154
## 3 IV(single) 9 49 455 0.0429 0.222 0.108
## 4 Placebo 19 251 735 0.118 0.789 0.341
## 5 Topical 5 32 296 0.0571 0.174 0.1084.4.5 モデル実行
n.adapt、n.inter、thin を色々試して、DIC 値を下げる。
## Compiling model graph
##    Resolving undeclared variables
##    Allocating nodes
## Graph information:
##    Observed stochastic nodes: 44
##    Unobserved stochastic nodes: 25
##    Total graph size: 913
##
## Initializing model## Compiling model graph
## Resolving undeclared variables
## Allocating nodes
## Graph information:
## Observed stochastic nodes: 44
## Unobserved stochastic nodes: 49
## Total graph size: 971
##
## Initializing model4.4.6 収束の評価
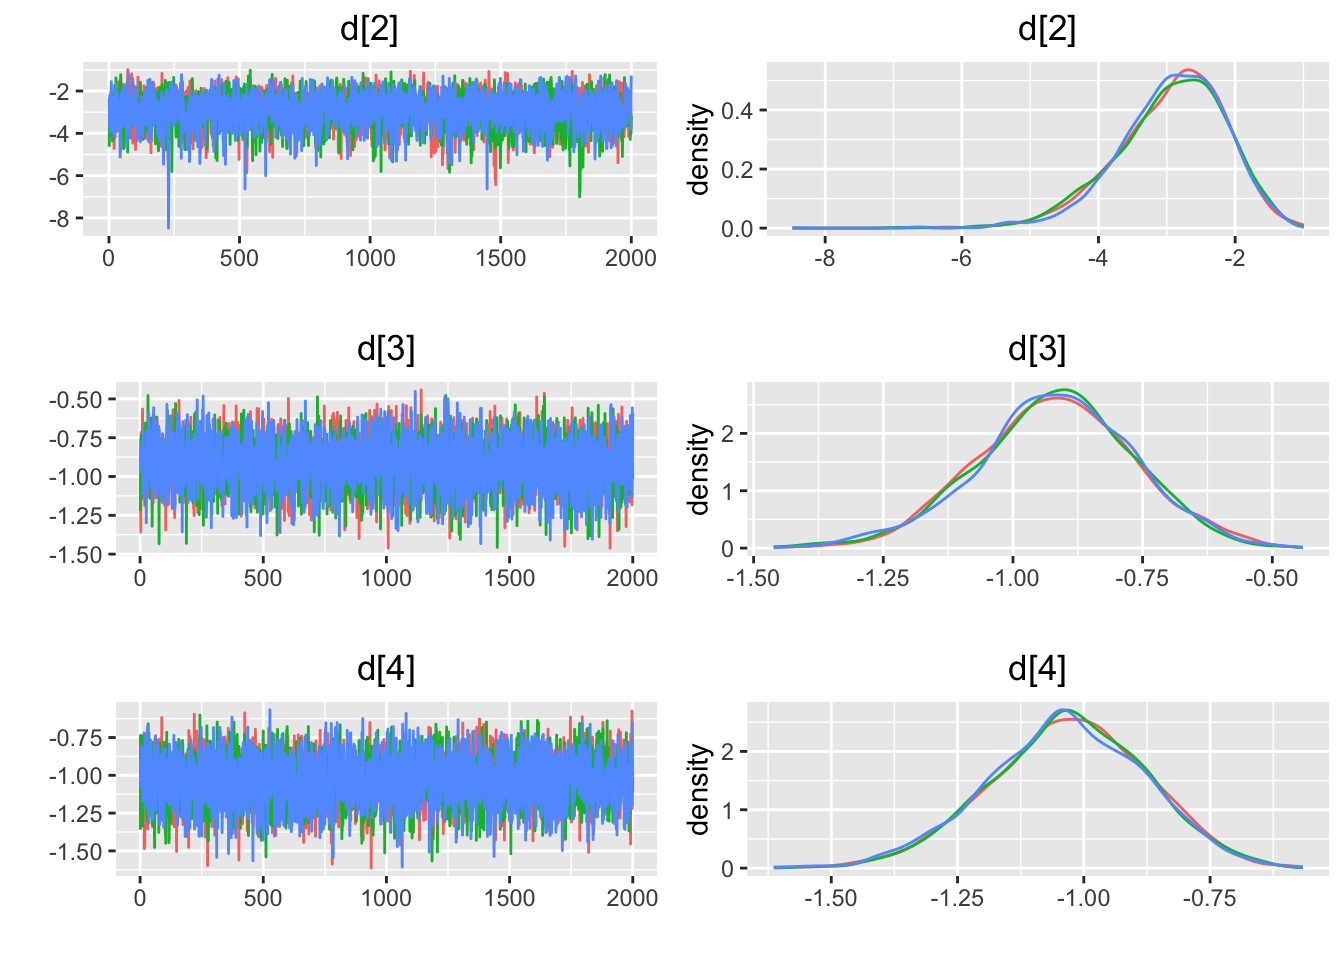
## Press [ENTER] to continue plotting trace plots (or type 'stop' to end plotting)>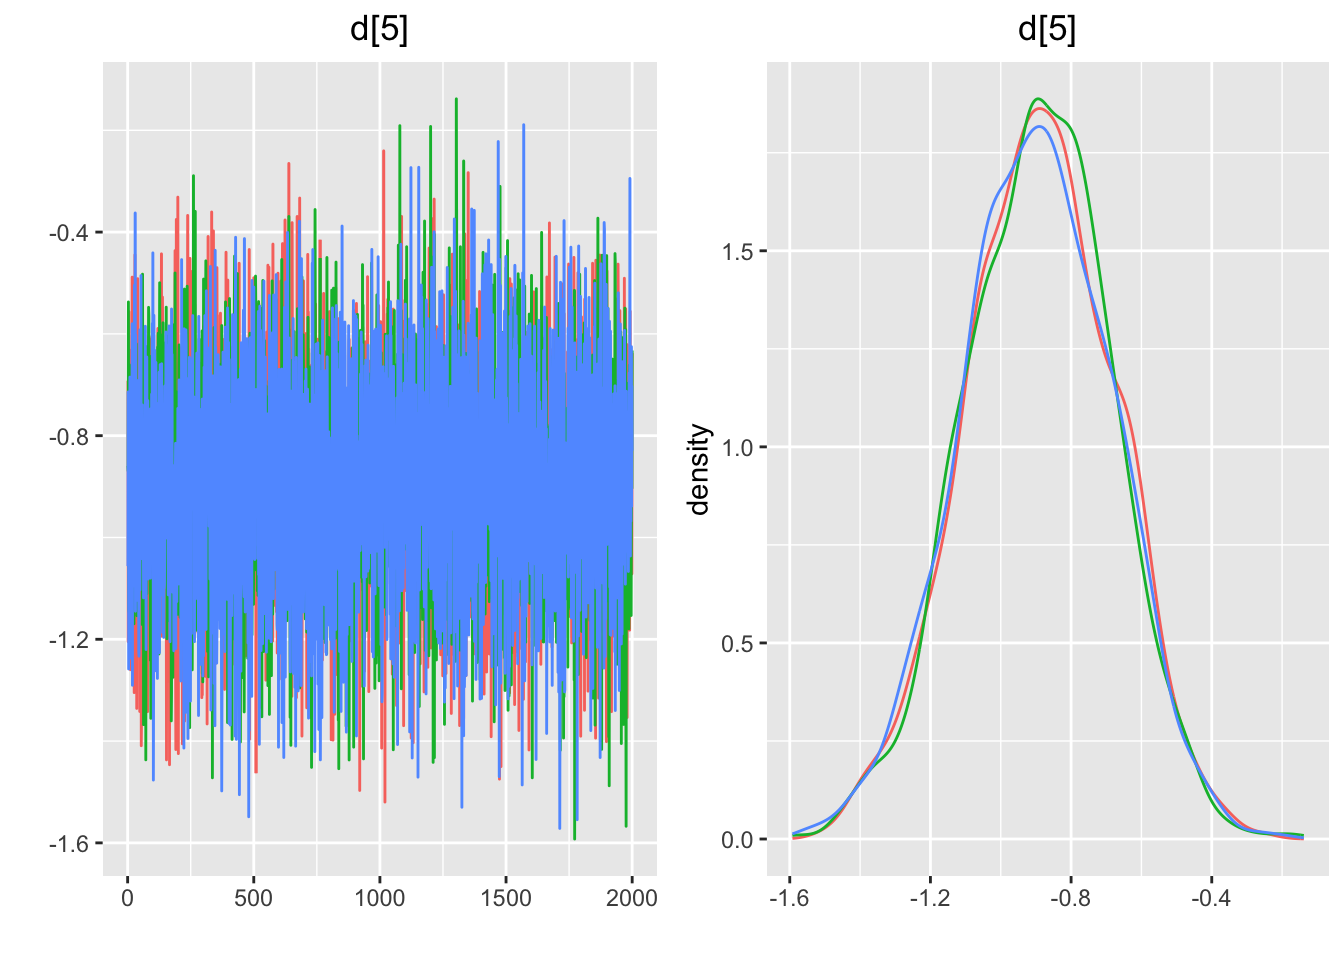
## $gelman.rubin
## $psrf
##      Point est. Upper C.I.
## d[2]  1.0011269   1.001941
## d[3]  0.9999392   1.000426
## d[4]  1.0004132   1.001863
## d[5]  1.0005161   1.001967
##
## $mpsrf
## [1] 1.000781
##
## attr(,"class")
## [1] "gelman.rubin.results"
##
## $geweke
## $stats
##         Chain 1   Chain 2    Chain 3
## d[2]  1.1770380  1.759328  0.2339669
## d[3] -0.3599857  0.949046  2.1565662
## d[4] -1.8117420 -1.065798 -0.4953229
## d[5] -0.5566137  0.974360 -0.8817629
##
## $frac1
## [1] 0.1
##
## $frac2
## [1] 0.5
##
## attr(,"class")
## [1] "geweke.results"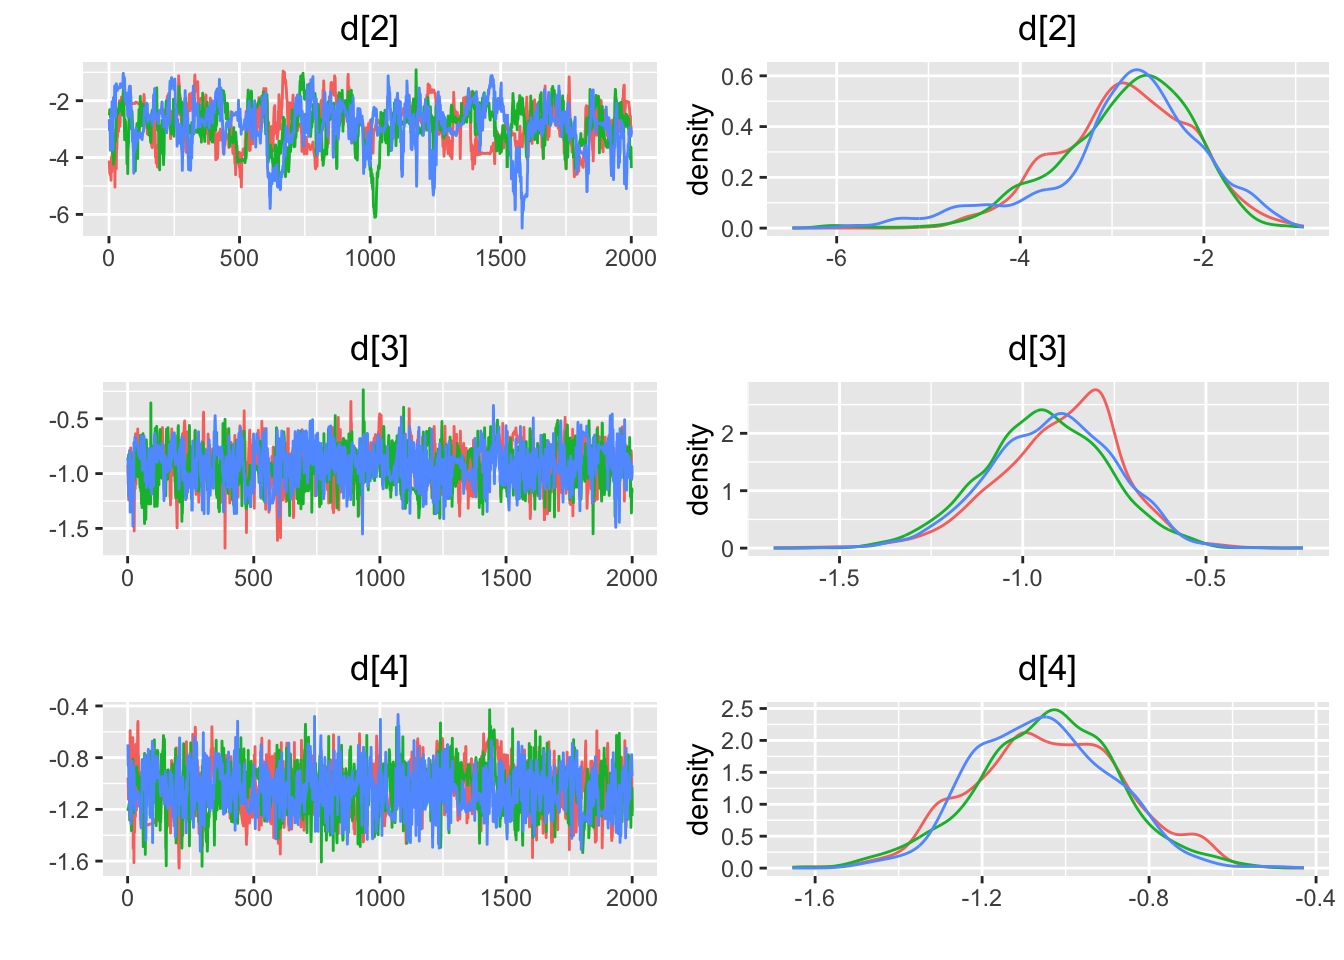
## Press [ENTER] to continue plotting trace plots (or type 'stop' to end plotting)>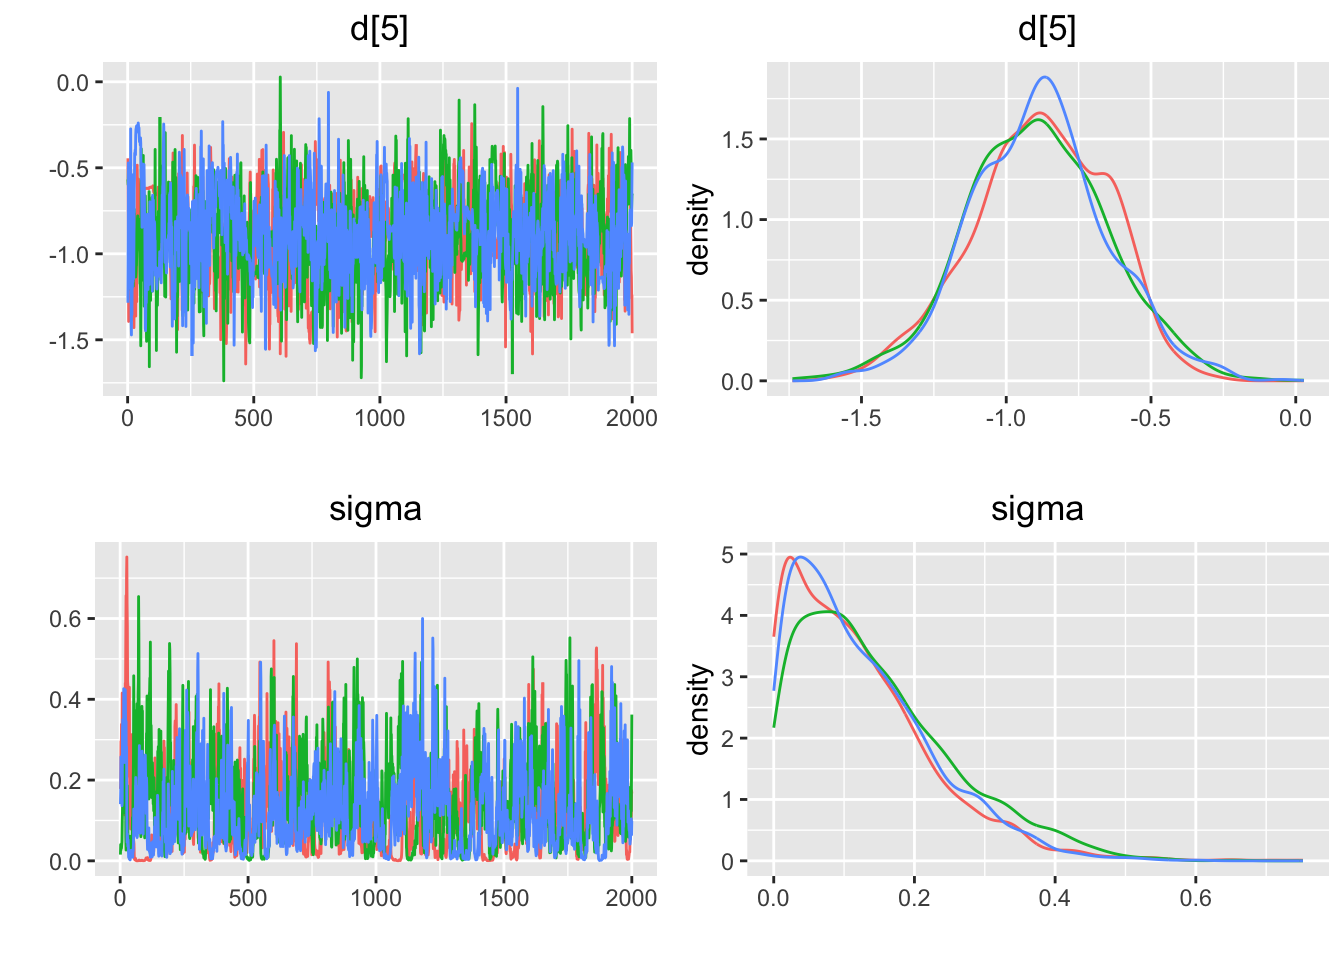
## $gelman.rubin
## $psrf
##       Point est. Upper C.I.
## d[2]    1.008952   1.013509
## d[3]    1.007807   1.028922
## d[4]    1.008897   1.030194
## d[5]    1.001571   1.001611
## sigma   1.008149   1.026589
##
## $mpsrf
## [1] 1.013912
##
## attr(,"class")
## [1] "gelman.rubin.results"
##
## $geweke
## $stats
##           Chain 1    Chain 2    Chain 3
## d[2]   0.34554879  0.1576119  1.4758055
## d[3]   0.51952647 -0.3227118  1.7893836
## d[4]  -2.47046992 -0.4766685  1.8454926
## d[5]   0.84433884 -0.5690322  0.3679685
## sigma  0.03047673  1.5451297 -0.9470941
##
## $frac1
## [1] 0.1
##
## $frac2
## [1] 0.5
##
## attr(,"class")
## [1] "geweke.results"
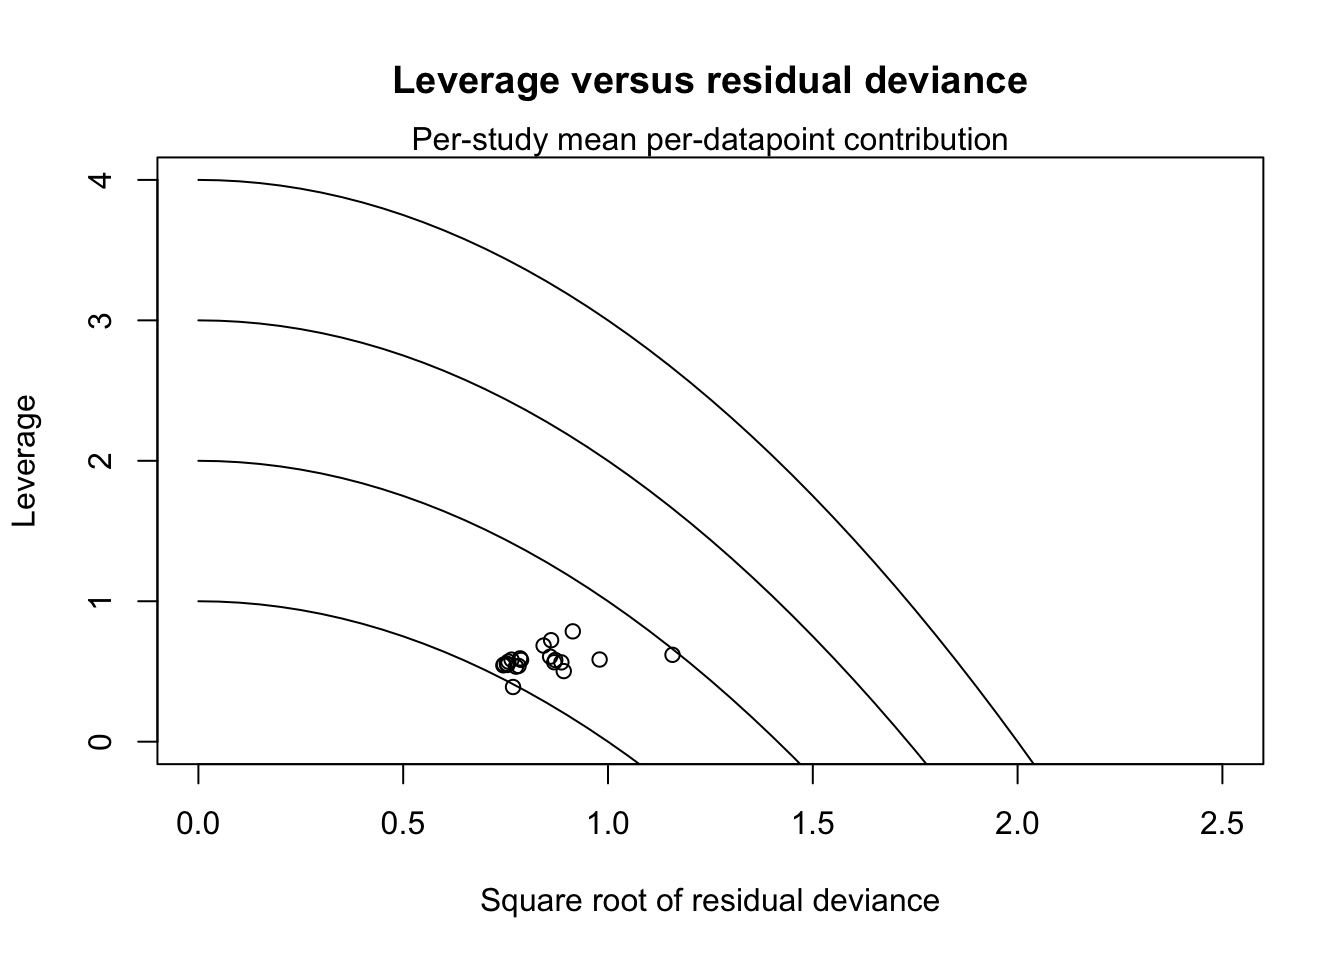
4.4.7 適合度の評価
## $DIC
## [1] NaN
##
## $Dres
## [1] 35.19666
##
## $pD
## [1] NaN
##
## $leverage
##
## 1 0.8510961 0.7954273 0.7511466 0.7227428 0.8175911 0.7530812 0.8245282
##
## 1 0.7674991 0.8103674 0.7846234 0.8042594 0.7906191 0.6507807 0.7097407
##
## 1 0.528403 0.7737046 0.6072549 0.853953 NaN 0.8037315 0.7989508 0.542343
##
## 1 0.2433383 0.3325903 0.2825313 0.1418778 0.1365729 0.1938588 0.2073352
##
## 1 0.3224485 0.3450891 0.3603541 0.2922035 0.3829345 0.3384641 0.7517083
##
## 1 0.2404573 0.4926623 0.2639675 0.4455989 0.5479469 0.2766524 0.5707307
##
## 1 0.3596409
##
## $w
##     r.1.1.     r.2.1.     r.3.1.     r.4.1.     r.5.1.     r.6.1.     r.7.1.
##  0.9230426  0.9139890 -0.8739319 -0.9411716  0.9172484  0.8818516  0.9471383
##     r.8.1.     r.9.1.    r.10.1.    r.11.1.    r.12.1.    r.13.1.    r.14.1.
##  0.8795874 -0.9092174 -0.9374383 -0.9007094  0.8903509 -0.9329204 -0.9849688
##    r.15.1.    r.16.1.    r.17.1.    r.18.1.    r.19.1.    r.20.1.    r.21.1.
## -1.0726859 -0.8799340 -0.8622804  1.0135525 -1.1331484 -0.9164031  0.9280639
##     r.1.2.     r.2.2.     r.3.2.     r.4.2.     r.5.2.     r.6.2.     r.7.2.
## -0.7614427 -0.7820965  1.3223899  0.8724185 -0.9246771 -1.0063228 -0.9445961
##     r.8.2.     r.9.2.    r.10.2.    r.11.2.    r.12.2.    r.13.2.    r.14.2.
## -0.6785818  0.6060522  0.8288304  0.6913264  0.6021495  0.7066410  1.0328672
##    r.15.2.    r.16.2.    r.17.2.    r.18.2.    r.19.2.    r.20.2.    r.21.2.
##  1.0199476 -0.5721775  0.7345210 -1.1511840 -0.7009580 -0.8082811 -0.9488264
##    r.19.3.    r.20.3.
##  0.7585455  0.7097092
##
## $pmdev
##  dev_a.1.1.  dev_a.2.1.  dev_a.3.1.  dev_a.4.1.  dev_a.5.1.  dev_a.6.1.
##   0.8520077   0.8353759   0.7637569   0.8858040   0.8413446   0.7776622
##  dev_a.7.1.  dev_a.8.1.  dev_a.9.1. dev_a.10.1. dev_a.11.1. dev_a.12.1.
##   0.8970709   0.7736741   0.8266762   0.8787906   0.8112775   0.7927247
## dev_a.13.1. dev_a.14.1. dev_a.15.1. dev_a.16.1. dev_a.17.1. dev_a.18.1.
##   0.8703405   0.9701636   1.1506549   0.7742839   0.7435275   1.0272886
## dev_a.19.1. dev_a.20.1. dev_a.21.1.  dev_a.1.2.  dev_a.2.2.  dev_a.3.2.
##   1.2840254   0.8397947   0.8613026   0.5797949   0.6116750   1.7487150
##  dev_a.4.2.  dev_a.5.2.  dev_a.6.2.  dev_a.7.2.  dev_a.8.2.  dev_a.9.2.
##   0.7611140   0.8550277   1.0126856   0.8922618   0.4604732   0.3672992
## dev_a.10.2. dev_a.11.2. dev_a.12.2. dev_a.13.2. dev_a.14.2. dev_a.15.2.
##   0.6869598   0.4779322   0.3625841   0.4993416   1.0668146   1.0402931
## dev_a.16.2. dev_a.17.2. dev_a.18.2. dev_a.19.2. dev_a.20.2. dev_a.21.2.
##   0.3273871   0.5395211   1.3252246   0.4913421   0.6533184   0.9002716
## dev_a.19.3. dev_a.20.3.
##   0.5753913   0.5036871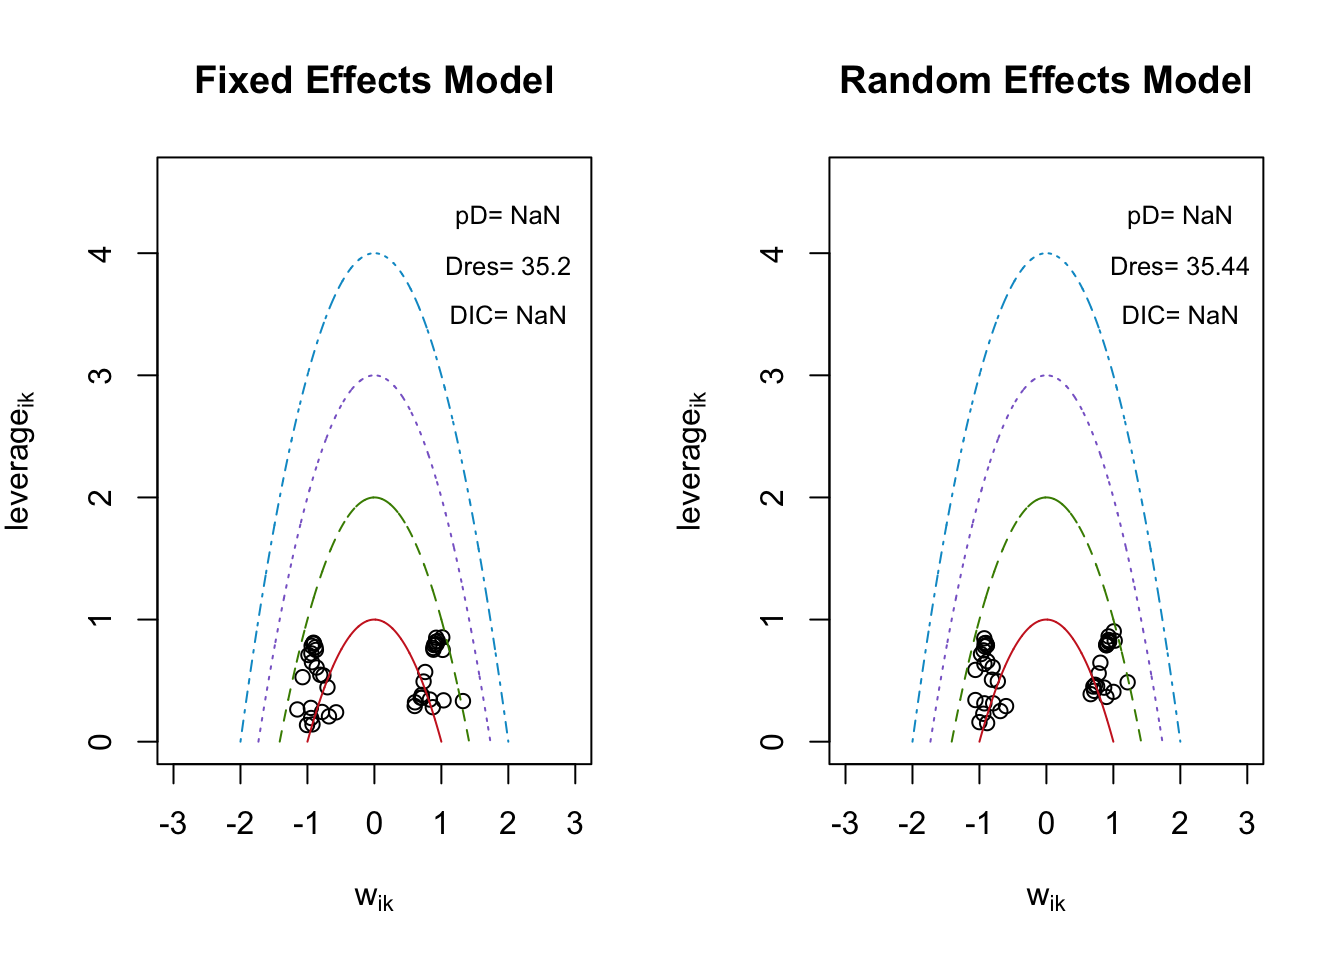
## $DIC
## [1] NaN
##
## $Dres
## [1] 35.43963
##
## $pD
## [1] NaN
##
## $leverage
##
## 1 0.8618813 0.832841 0.7881217 0.7479294 0.8007751 0.790337 0.8155798 0.7898441
##
## 1 0.8465064 0.7810928 0.8081403 0.7989712 0.6371681 0.7176032 0.5877003
##
## 1 0.7915699 0.6589927 0.903236 NaN 0.8055507 0.821902 0.6106636 0.3143952
##
## 1 0.486358 0.3666691 0.1522549 0.1601964 0.2287037 0.2508775 0.4514508
##
## 1 0.4426668 0.4659385 0.3892783 0.4164356 0.4078126 0.8270164 0.2913383
##
## 1 0.5594172 0.3410779 0.4944772 0.5075019 0.3141141 0.6466597 0.4532379
##
## $w
##     r.1.1.     r.2.1.     r.3.1.     r.4.1.     r.5.1.     r.6.1.     r.7.1.
##  0.9288517  0.9310373 -0.8884814 -0.9403511  0.9075396  0.8997775  0.9307761
##     r.8.1.     r.9.1.    r.10.1.    r.11.1.    r.12.1.    r.13.1.    r.14.1.
##  0.8933791 -0.9277003 -0.9232933 -0.9033516  0.8962077 -0.9258859 -0.9762992
##    r.15.1.    r.16.1.    r.17.1.    r.18.1.    r.19.1.    r.20.1.    r.21.1.
## -1.0601508 -0.8907308 -0.8818779  1.0056558 -1.1618090 -0.9214147  0.9368581
##     r.1.2.     r.2.2.     r.3.2.     r.4.2.     r.5.2.     r.6.2.     r.7.2.
## -0.8024576 -0.7945907  1.2129597  0.8962044 -0.8855485 -0.9998533 -0.9422713
##     r.8.2.     r.9.2.    r.10.2.    r.11.2.    r.12.2.    r.13.2.    r.14.2.
## -0.6879429  0.7012885  0.8623843  0.7279524  0.6609818  0.7128843  1.0008087
##    r.15.2.    r.16.2.    r.17.2.    r.18.2.    r.19.2.    r.20.2.    r.21.2.
##  1.0196810 -0.6025431  0.7808645 -1.0599581 -0.7256137 -0.8130561 -0.9267103
##    r.19.3.    r.20.3.
##  0.8062732  0.7573465
##
## $pmdev
##  dev_a.1.1.  dev_a.2.1.  dev_a.3.1.  dev_a.4.1.  dev_a.5.1.  dev_a.6.1.
##   0.8627655   0.8668304   0.7893992   0.8842602   0.8236282   0.8095996
##  dev_a.7.1.  dev_a.8.1.  dev_a.9.1. dev_a.10.1. dev_a.11.1. dev_a.12.1.
##   0.8663441   0.7981262   0.8606278   0.8524705   0.8160441   0.8031882
## dev_a.13.1. dev_a.14.1. dev_a.15.1. dev_a.16.1. dev_a.17.1. dev_a.18.1.
##   0.8572648   0.9531602   1.1239196   0.7934013   0.7777086   1.0113436
## dev_a.19.1. dev_a.20.1. dev_a.21.1.  dev_a.1.2.  dev_a.2.2.  dev_a.3.2.
##   1.3498002   0.8490051   0.8777030   0.6439382   0.6313743   1.4712713
##  dev_a.4.2.  dev_a.5.2.  dev_a.6.2.  dev_a.7.2.  dev_a.8.2.  dev_a.9.2.
##   0.8031823   0.7841961   0.9997065   0.8878752   0.4732654   0.4918056
## dev_a.10.2. dev_a.11.2. dev_a.12.2. dev_a.13.2. dev_a.14.2. dev_a.15.2.
##   0.7437066   0.5299147   0.4368969   0.5082040   1.0016181   1.0397493
## dev_a.16.2. dev_a.17.2. dev_a.18.2. dev_a.19.2. dev_a.20.2. dev_a.21.2.
##   0.3630582   0.6097494   1.1235111   0.5265152   0.6610602   0.8587920
## dev_a.19.3. dev_a.20.3.
##   0.6500764   0.5735737
sD/DIC が計算されない。調査中。
